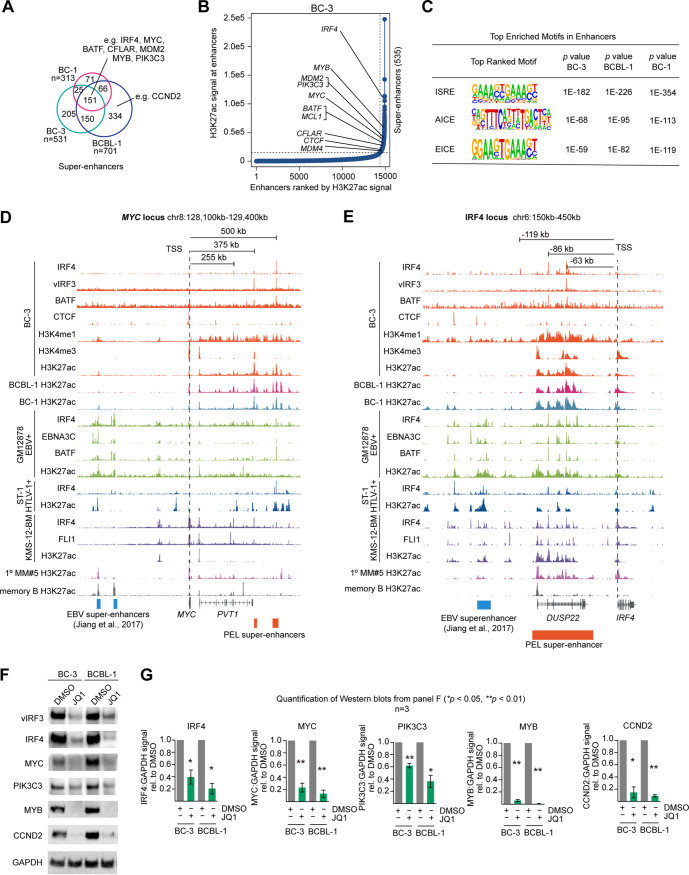
FIG 3.
vIRF3, IRF4, and BATF cooccupy super-enhancers (SEs) in PEL cell lines. (A) Overlap of SEs that were identified by ROSE in BC-3, BCBL-1, and BC-1. Candidate SEs for essential genes in PEL are indicated. For complete results in BC-3, BC-1, and BCBL-1, see Table S3. Note that numbers do not add up exactly as described for Table S3, since the HOMER mergePeaks function automatically resolves redundant overlaps by dropping one fragment during analysis; for instance, two distinct shorter SEs from one cell line cannot be logically merged with a longer overlapping SE from a second cell line and plotted in a Venn diagram. (B) Ranking of enhancers and identification of super-enhancers in BC-3, using ROSE. Candidate SEs for essential genes in PEL are indicated. For results in BC-1 and BCBL-1 see Fig. S7B and C. (C) HOMER motif analysis of all enhancers, including both typical enhancers and SEs, determined by ROSE in BC-3, BCBL-1, and BC-1 identified the composite ISRE, AICE, and EICE motifs as the top enriched motifs in each cell line. (D) IRF4, vIRF3, and BATF occupancy and nucleosome modifications by H3K27ac, H3K4me1, and H3K4me3 near MYC in BC-3. Also shown are BCBL-1 and BC-1 H3K27ac marks. For reference, the IRF4, EBNA3C, and H3K27ac ChIP-Seq marks in the LCL GM12878 (from ENCODE) are shown in green; data from the ATLL cell line ST-1 are shown in dark blue; and tracks from the multiple myeloma cell line KMS12-BM, a primary case of multiple myeloma (1° MM#5), and primary memory B cells are shown in shades of purple. The MYC EBV-SEs previously identified in LCL (60) are shown at the bottom of the panel. PEL SEs from BC-3 are indicated by orange boxes. Published data sets (GSE52632, GSE65516, PRJEB25605, and GSE94732) were downloaded from NCBI. (E) Data are presented as described for panel D but with a focus on the region upstream of the IRF4 locus, representing the candidate IRF4 SE in PEL (orange box at bottom). The location of the IRF4 EBV-SE region in LCL is shown at the bottom of the panel (Jiang et al.; 60). (F) Western blot analyses of the expression of essential genes IRF4, vIRF3, MYC, PIK3C3, MYB, and CCND2 2 days after treatment of BC-3 or BCBL-1 cells with 1 μM JQ1. (G) Quantification of Western blots as described for panel F, over n = 3 biological replicates. Error bars represent standard errors of the means (SEM). *, P < 0.05; **, P < 0.01 (paired two-sided Student's t tests).

