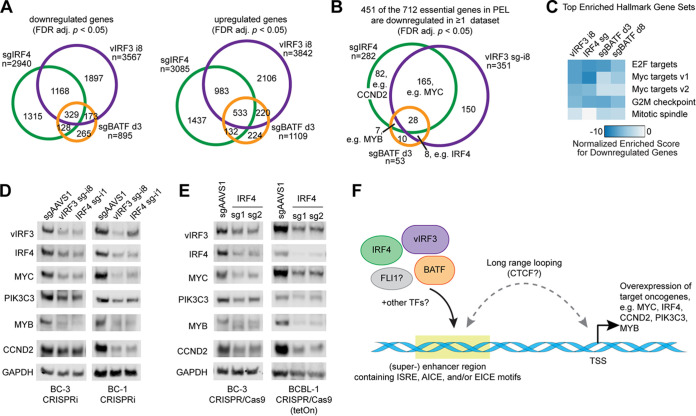
FIG 6.
Inactivations of IRF4, vIRF3, and BATF have similar consequences for gene expression. (A) Overlap of differentially expressed genes (FDR-adj. P < 0.05, no fold change cutoff) in mRNA-Seq experiments after IRF4 KO, BATF KO, or vIRF3 KD in BC-3 cells, compared to matched sgAAVS1 controls. d3, day 3. (B) Downregulation (FDR-adj. P < 0.05, no fold change cutoff) of a large subset of the 712 genes that we had previously identified as essential across PEL cell lines (21) in the mRNA-Seq experiments after IRF4 KO, BATF KO, or vIRF3 KD in BC-3 cells, compared to matched sgAAVS1 controls. (C) Heat map showing enrichment of Hallmark gene sets among the downregulated genes, identified using gene set enrichment analysis. The top four enriched categories from any of the data sets are shown across all data sets. (D and E) Western blot analyses of the expression of candidates for vIRF3/IRF4/SE-controlled essential genes (IRF4, MYC, PIK3C3, MYB, CCND2) and loading control GAPDH, following CRISPRi-mediated KD of vIRF3 and IRF4 in BC-3 or BC-1 cells (D) or CRISPR/Cas9-mediated KO of IRF4 in BC-3 or BCBL-1 cells (E), as indicated. Western blots for n ≥ 3 biological replicates were quantified, and results are shown in Fig. S9. (F) Proposed working model of the cooperative functions of vIRF3, IRF4, and BATF in the positive regulation of cellular super-enhancers in PEL cell lines.

