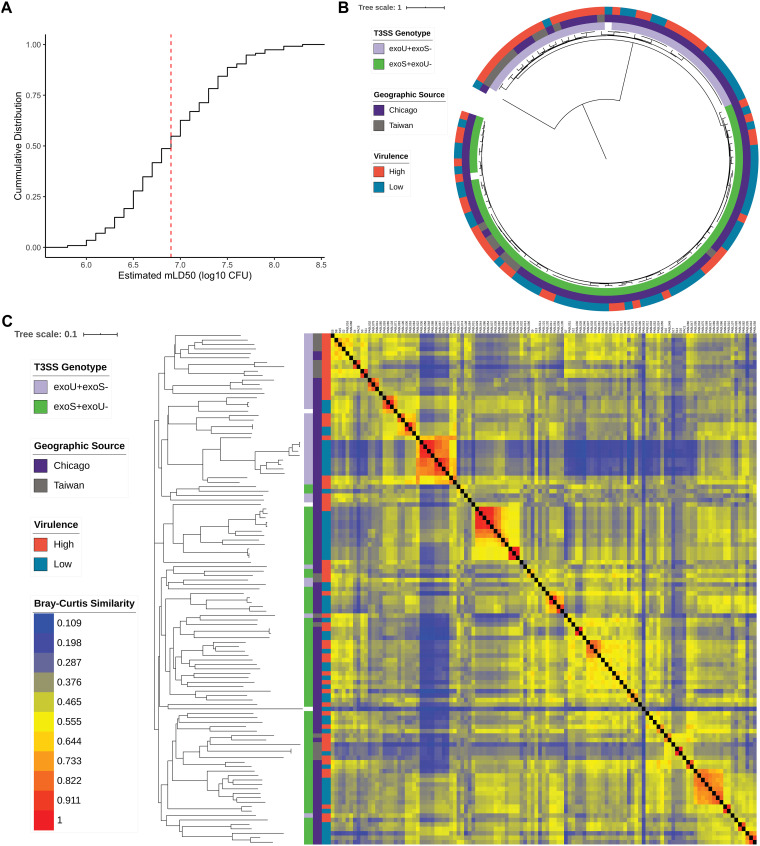
FIG 1.
Virulence and genomic characteristics of the training set of 115 P. aeruginosa isolates. (A) Cumulative distribution function of estimated mLD50 values for the 115 isolates in a mouse model of bacteremia. Isolates with estimated mLD50 values less than the median value (red dashed line) were designated high virulence, with the remainder designated low virulence. (B) Midpoint rooted core genome phylogenetic tree of the 115 training isolates constructed from SNV loci present in at least 95% of genomes, annotated with T3SS genotype, geographic source, and virulence level. (C) Bray-Curtis dissimilarity heatmap comparing AGE presence in the 115 training isolates, weighted by AGE length, and accompanying neighbor joining tree. Isolates are annotated (from left to right) by T3SS genotype, geographic source, virulence level, and the dissimilarity heatmap. A higher value indicates that two isolates have more similar accessory genomes.

