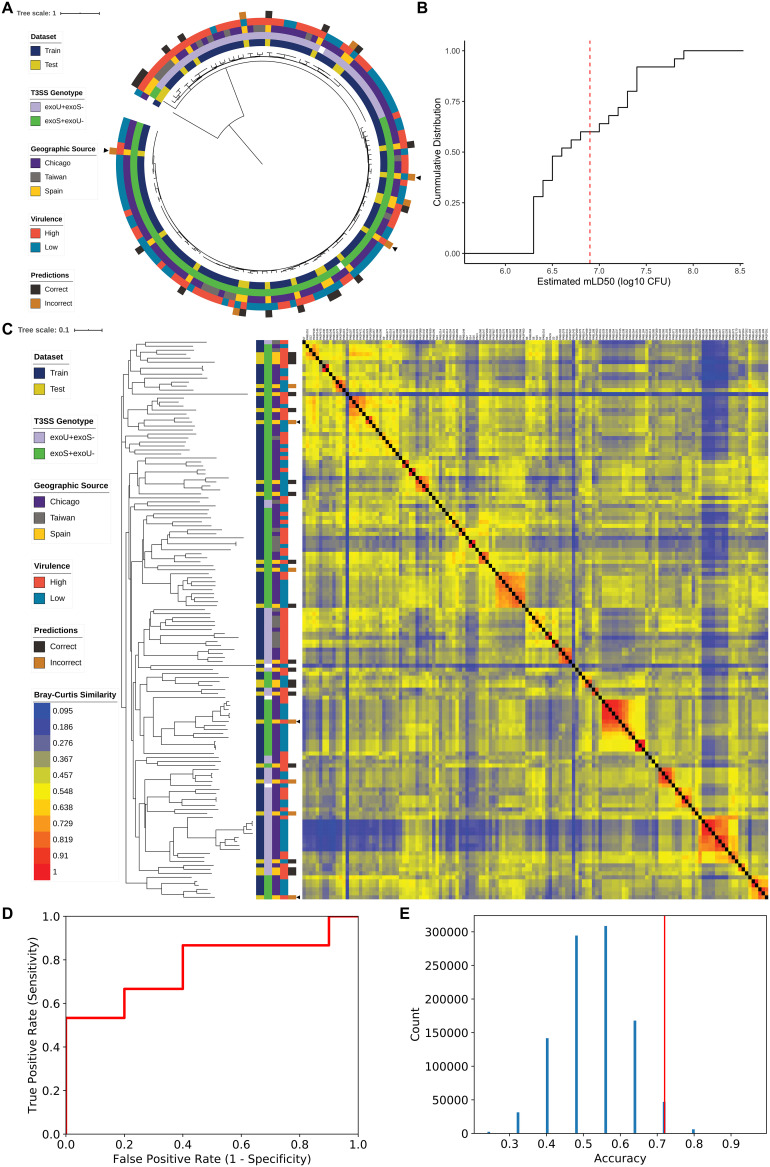
FIG 4.
Characteristics of a random forest model trained on the accessory genomic content of the 115 P. aeruginosa training isolates to predict the virulence of an independent test set of 25 isolates. (A) Midpoint rooted core genome phylogenetic tree of the 115 training isolates and 25 test isolates constructed from SNV loci present in at least 95% of genomes, annotated (from inner to outer rings) with data set, T3SS genotype, geographic source, virulence level, and accuracy of prediction by the accessory genome random forest model for test set isolates. Arrowheads indicate examples of incorrectly classified test set strains whose closest core and accessory genomic neighbor(s) show a discordant virulence phenotype. (B) Cumulative distribution function of estimated mLD50 values for the 25 P. aeruginosa isolates making up the independent test set in a mouse model of bacteremia. Isolates with estimated mLD50 values less than the median estimated mLD50 of the training set (red dashed line) were designated high virulence, with the remainder designated low virulence. (C) Bray-Curtis dissimilarity heatmap comparing presence of the 3,013 AGEs identified in the training set in all 140 isolates, weighted by AGE length, and accompanying neighbor joining tree. Isolates are annotated (from left to right) by data set, T3SS genotype, geographic source, virulence level, accuracy of prediction by the accessory genome random forest model in test set isolates (arrowheads highlighting specific incorrectly classified test set strains as in panel A), and the dissimilarity heatmap. A higher value indicates that two isolates have more similar accessory genomes. (D) Receiver operating characteristic curve for predictions of the 25 test set isolates using the random forest model (AUC = 0.77). (E) Permutation analysis showing the likelihood of predicting test virulence with an accuracy of at least 0.72 if no true link between virulence and accessory genomic content existed. The predicted virulence of the 25 test isolates were randomly permuted 1 million times, and the resulting null distribution of possible model accuracies is shown. The vertical red line indicates the true accuracy of the random forest model in predicting test set virulence (one-sided P = 0.053).

