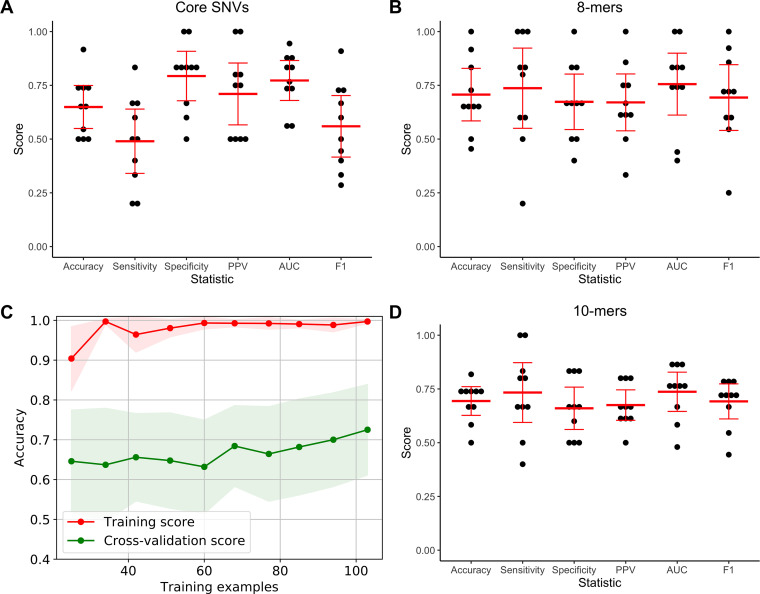
FIG 6.
Performance of the random forest algorithm in predicting P. aeruginosa virulence when 8-mer counts, 10-mer counts, or core genome SNVs were used as model features. Nested cross-validation performance when using (A) core genome SNVs, (B) 8-mer counts, and (D) 10-mer counts, including accuracy, sensitivity, specificity, positive predictive value (PPV), area under the receiver operating characteristic curve (AUC), and F1 score. The results for each cross-validation fold are shown in black with the mean and 95% confidence interval of each statistic indicated in red. (C) Learning curve showing change in mean training accuracy (red line) and cross-validation accuracy (green line) when using 8-mer counts as features as increasing numbers of isolates are used to train the random forest model. Shading indicates the 95% confidence interval. Assessments at each number of training examples were through 10-fold nested cross-validation. Learning curves were not constructed when using core genome SNV or 10-mer counts as features for reasons of computational feasibility.

