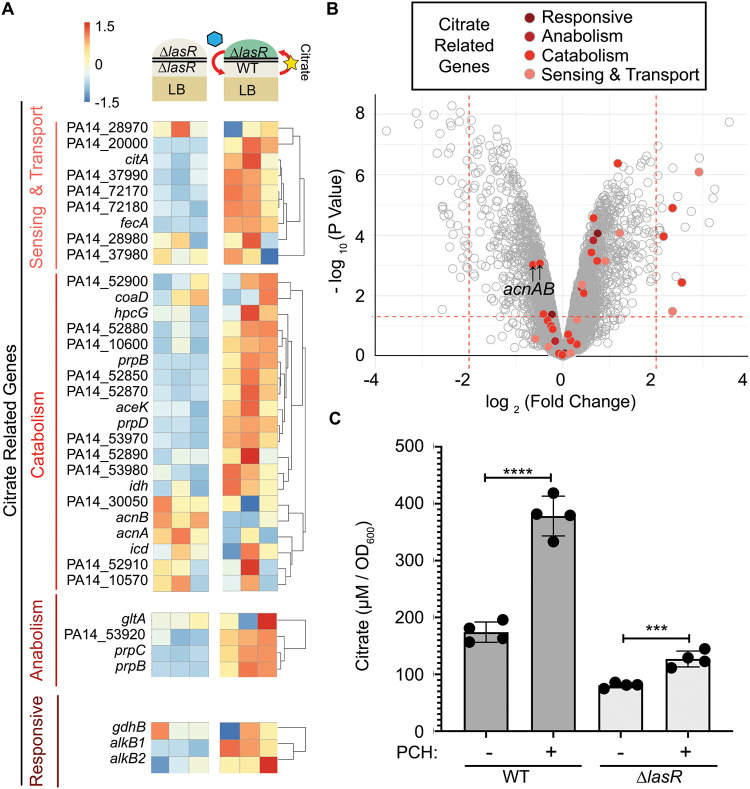
FIG 4.
Citrate release by WT is induced by pyochelin exposure. (A) Subset of expression data in ∆lasR cocultures (Fig. 3A shows the setup) for genes annotated as being involved in citrate sensing, transport, catabolism, anabolism, and those shown to be responsive to citrate. (B) Volcano plot of expression data of ∆lasR cocultures with each point representing the log2(∆lasR cells grown on WT/∆lasR cells grown on ∆lasR cells) expression and –log10(P value) of a single gene. Genes shown in panel A are highlighted in color. (C) Citrate concentrations in supernatants from wild-type and ∆lasR stationary-phase cultures after growth in LB medium supplemented with extracts containing 50 μM pyochelin (PCH+) or an equal volume of control extracts (PCH−). A representative experiment with four biological replicates repeated 3 independent days is shown. ***, P < 0.0005; ****, P ≤ 0.0001, as determined by two-tailed t tests of paired ratios.

