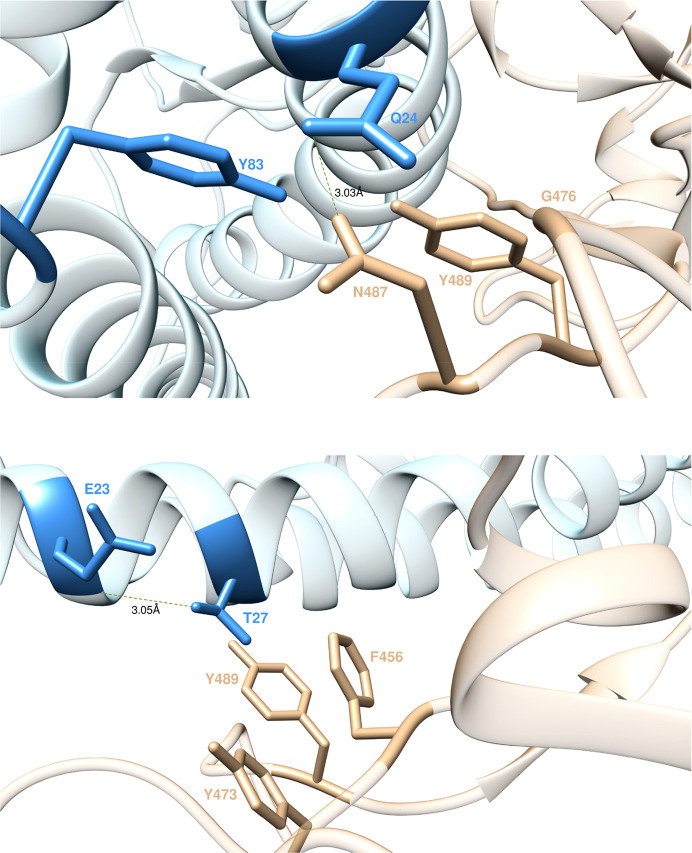
Figure 3.
Main interactions involving ACE2 residues Q24 (top) and T27 (bottom) at the interface with S-RBDCoV-2 as obtained from equilibrated MD simulations. In this and all remaining figures, the secondary structures of ACE2 and S-RBDCoV-2 are portrayed as light blue and light sienna ribbons, respectively. Each interacting protein residue is highlighted with matching-colored sticks and labeled. Hydrogen bonds (HBs) and salt bridges (SBs) are represented as dark green and dark red broken lines, respectively, and the relevant average distances are reported accordingly (see Tables S1 and S2 for details).

