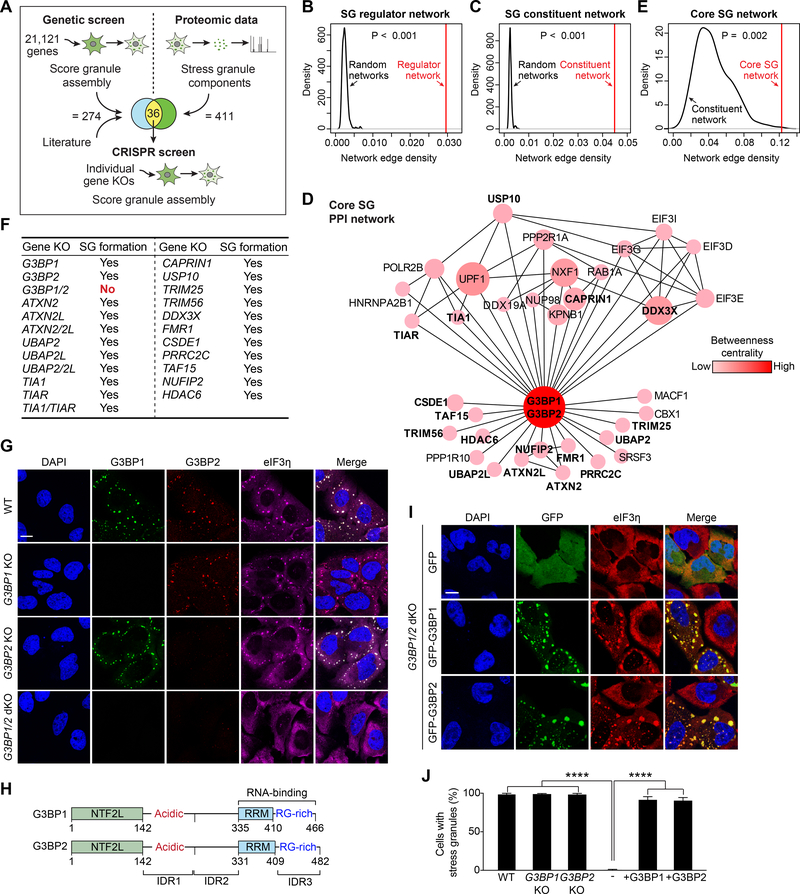
Figure 1. G3BP Is the Node of Highest Centrality within the Core Stress Granule (SG) Network.
(A) Approach used to identify the core SG network. A genome-wide siRNA screen was performed in heat-shocked U2OS cells expressing G3BP1-GFP. Results from this screen were combined with published results and integrated with proteomic datasets. Genes that overlapped between the genetic screen and the proteomic datasets were assessed individually by CRISPR-Cas9-based knockout (KO).
(B-C) Network analyses showing connectivity (network edge density) of the SG regulator network (B) and SG constituent network (C). P values were estimated by empirically calculating the probability of observing a denser network by randomly sampling 1,000 subnetworks of similar size from the entire interactome.
(D) The core SG network of 36 core genes identified using the approach illustrated in (A). The color density and size of each node is proportional to its betweenness centrality in the network. Genes tested by CRISPR-Cas9 in (F) are in bold.
(E) Network analysis of 36 core SG genes comparing connectivity with the SG constituent network. The P value was estimated similarly as in (B-C) but using the network of SG constituents as background.
(F) U2OS cell lines with CRISPR-Cas9-based single or double KOs. Cells were exposed to sodium arsenite (500 μM, 1 h) and SG assembly was assessed by staining with a panel of 17 SG markers.
(G) U2OS cells with KO of G3BP1, G3BP2, or both G3BP1 and G3BP2 were exposed to sodium arsenite (500 μM, 1 h) and stained for the SG marker eIF3η. Scale bar, 20 μm.
(H) Comparison of human G3BP1 and G3BP2 proteins. NTF2L, NTF2-like; IDR, intrinsically disordered region; RRM, RNA-recognition motif; RG-rich: arginine-glycine rich.
(I-J) G3BP1/2 dKO cells were transfected with GFP-G3BP1 or GFP-G3BP2, exposed to sodium arsenite (500 μM, 1 h), and stained for eIF3η. Cells were imaged (I) and the percentage of cells positive for SGs was quantified (J). Error bars indicate SD. ****P < 0.0001 by one-way ANOVA, Tukey’s multiple comparisons test. Scale bar, 20 μm.

