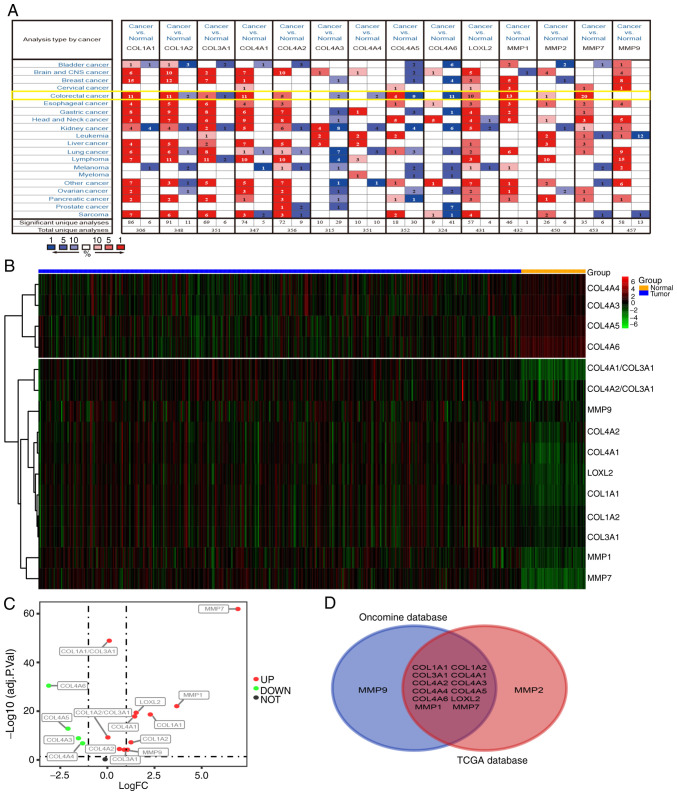
Figure 4.
mRNA expression levels of collagens and collagenases in various types of cancer. (A) High or low expression of related coding genes in different types of human cancer tissues, compared with normal tissues, using the Oncomine database (P<0.01). mRNA expression levels in CRC are highlighted in yellow. (B and C) Expression patterns of related coding genes in CRC using TCGA database (P<0.01). (D) Intersection between all related coding genes (n=14) among Oncomine and TCGA expression data. CRC, colorectal cancer; TCGA, The Cancer Genome Atlas.

