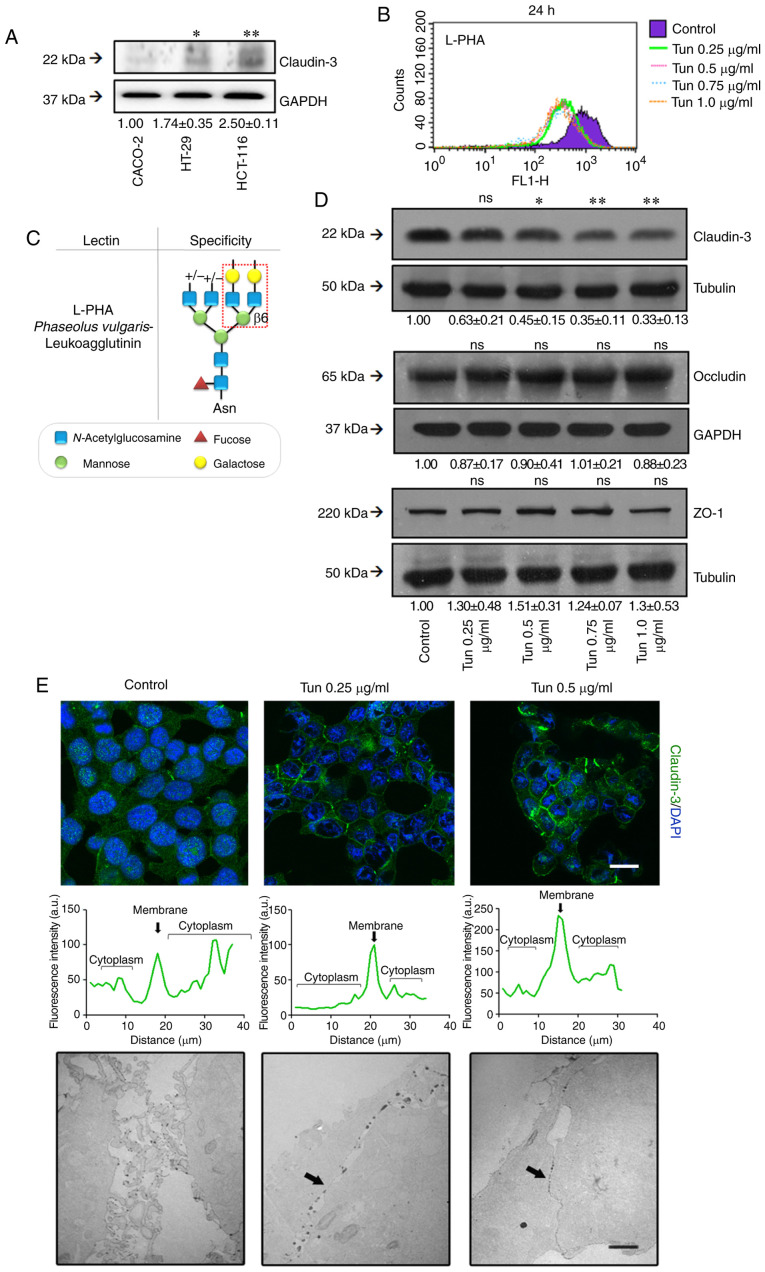
Figure 2.
Effects of N-glycan biosynthesis inhibition on TJ stability. (A) Cell lysates from Caco-2, HT-29, and HCT-116 cells were analyzed by western blotting for claudin-3. (B) HCT-116 cells were treated with different concentrations of tunicamycin for 24 h. After treatment, the cells were incubated with FITC-conjugated lectin L-PHA and analyzed by flow cytometry. The histograms of fluorescence were generated by the Cell Quest software: control (purple); 0.25 µg/ml (green); 0.5 µg/ml (pink); 0.75 µg/ml (blue); and 1 µg/ml (orange). (C) Lectin L-PHA specificity. (D) Cell lysates were obtained after 24 h treatment with tunicamycin and analyzed by western blotting for claudin-3, occludin, and ZO-1. Tubulin was used as an endogenous protein control. (E, upper panel) Cell monolayers were fixed and stained for claudin-3 (green) and nuclei (blue) (DAPI). Representative images were obtained by confocal microscopy. The graphs represent the fluorescence intensity in cytosolic and membrane regions of neighboring cells. Scale bar, 10 µm. (E, lower panel) Cells were cultured in filters of Transwell polycarbonate, and the functionality of TJs was analyzed by transmission electron microscopy (MET) using ruthenium red as a tracer. The images are representative of ultrathin sections of treated and control cells. Black arrows indicate the cell-cell contact. Scale bar, 2 µm. The numerical values represent densitometric units ± standard error (n=3). ns, not significant (P>0.05); *P<0.05; **P<0.01; ANOVA. Tun, tunicamycin; TJ, tight junction; L-PHA, phytohemagglutinin-L or Phaseolus vulgaris leucoagglutinin.

