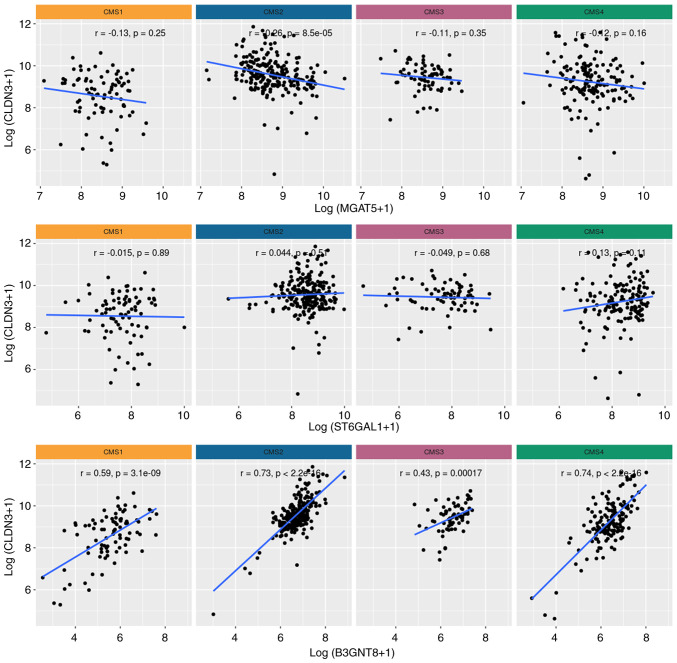
Figure 4.
Correlation analyses between CLDN3 and MGAT5, ST6GAL1, and B3GNT8 within the CMS. The correlation graphs represent the relationship between gene expression data from The Cancer Genome Atlas (TCGA) project database that were later classified for stratification as consensus molecular subtypes (CMSs). CLDN3, gene encoding claudin-3; MGAT5, α-mannoside β-1,6-N-acetylglucosaminyltransferase; ST6GAL1, ST6 β-galactoside α-2,6-sialyltransferase; B3GNT8, β-1,3-N-αcetylglucosaminyltransferase 8.

