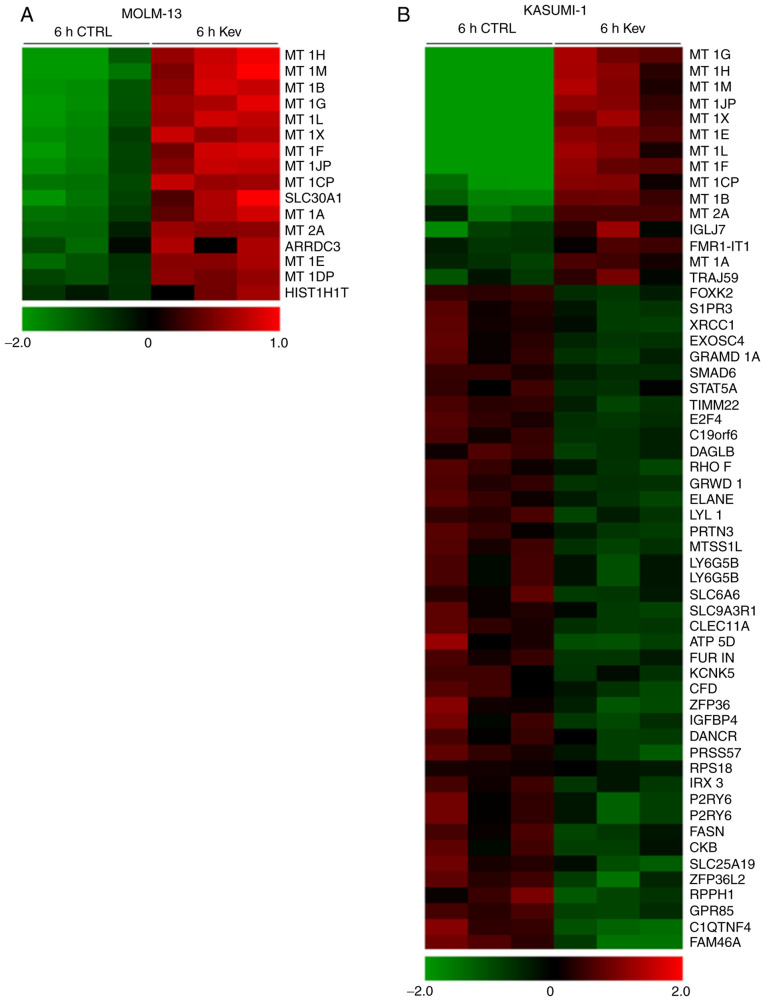
Figure 2.
Short-term gene expression profile of kevetrin-treated AML cell lines. Genes differentially expressed in (A) MOLM-13 and (B) KASUMI-1 cells untreated (6 h CTRL) or treated (6 h Kev) for 6 h with kevetrin 340 µM. Color changes within a row indicate gene expression levels relative to the mean (red and green indicate upregulation and downregulation, respectively). AML, acute myeloid leukemia; Kev, kevetrin.

