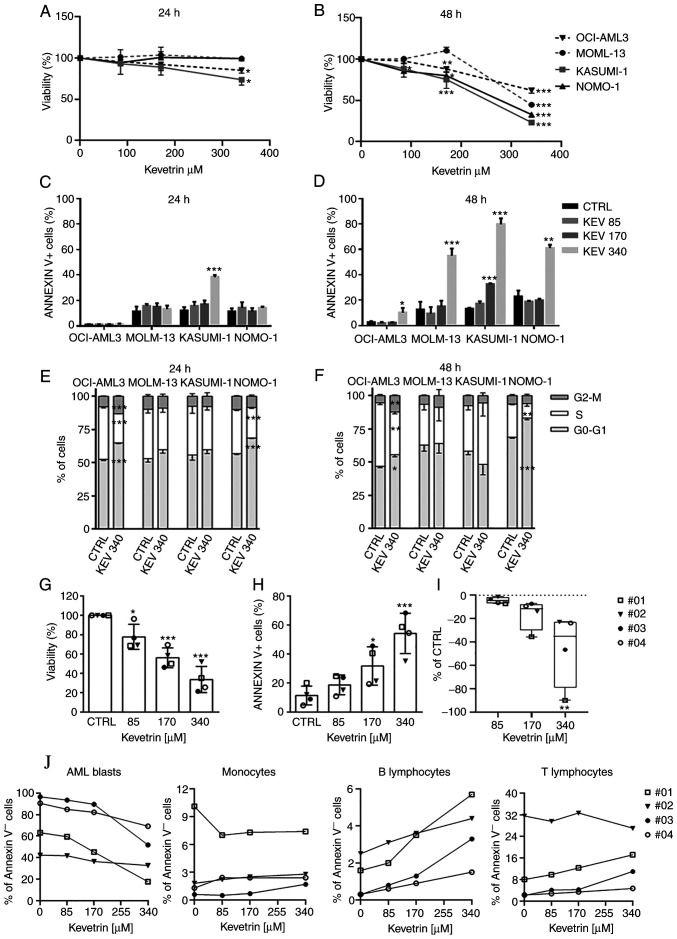
Figure 3.
Effect of continuous kevetrin treatment on viability and apoptosis induction in AML cell lines and primary samples. (A and B) Viability of TP53-wt OCI-AML3 and MOLM-13 and TP53-mut KASUMI-1 and NOMO-1 cell lines treated with different concentrations of kevetrin (85, 170 and 340 µM) for 24 and 48 h. (C and D) Quantification of Annexin V+ cells in AML cell lines treated with kevetrin at different concentrations (85, 170 and 340 µM) for 24 and 48 h. (E and F) Cell cycle analysis of cell lines treated with 340 µM kevetrin for 24 and 48 h. Values represent the mean ± standard deviation of three biological replicates. (G) Cell viability and (H) percentage of Annexin V+ cells in bone marrow mononuclear cells from AML patients exposed to increasing concentrations of kevetrin. (I) Percentage of AML blasts relative to control. Values represent the mean ± standard deviation. Symbols indicate samples from AML patients (no. 01: TP53-mut AML; nos. 02, 03 and 04: TP53-wt AML). (J) Percentage of Annexin V− cells in AML blasts, monocytes and lymphocytes. Blasts were defined as CD33+CD14− cells in the CD45/side scatter ‘blast gate’, monocytes as CD33+CD14+, B lymphocytes as CD19+ and T lymphocytes as CD3+. *P<0.05, **P<0.01, ***P<0.001. AML, acute myeloid leukemia; KEV, kevetrin; CTRL, control; wt, wild-type.

