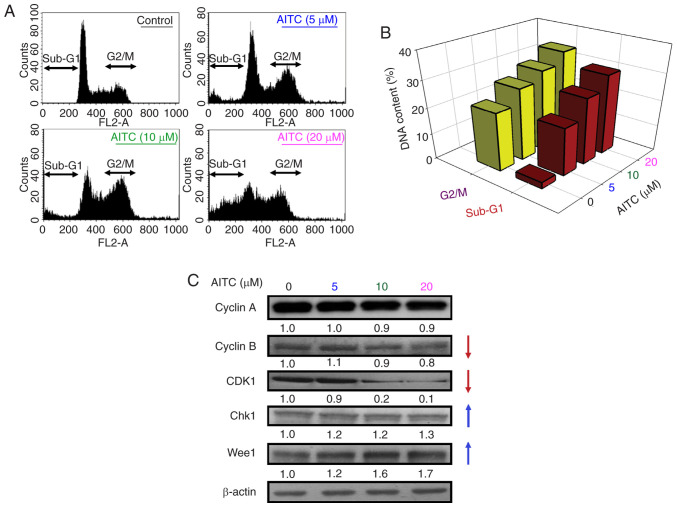
Figure 2.
Effects of AITC on cell cycle progression and G2/M phase-regulated protein levels of HT-29 cells. The cells were exposed to various concentrations (0, 5, 10 and 20 µM) of AITC for 24 h. (A) Representative images of the cell cycle distribution, as determined using flow cytometric analysis. (B) Quantification of G2/M phase and sub-G1 population. (C) The total protein in the cell extracts was subjected to western blot to detect G2/M progression-associated proteins (cyclin A, cyclin B, CDK1, Chk1 and Wee1). All blots were normalized to β-actin to ensure the same amount of loading of each sample across all samples. AITC, allyl isothiocyanate; CDK1, cyclin-dependent kinase 1; Chk1, checkpoint kinase 1.

