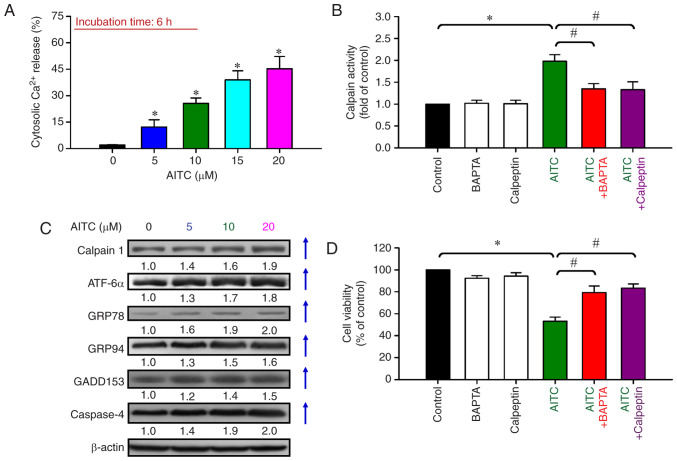
Figure 5.
Effects of AITC on cytosolic Ca2+ and ER stress signaling of HT-29 cells. (A) Cells were treated with AITC (0, 5, 10, 15 and 20 µM) for 6 h, and the level of cytosolic Ca2+ was assessed via fluo-3/AM and flow cytometry. *P<0.05 vs. the control; statistical significance was determined by ANOVA (Dunnett's test). (B) The cells were pretreated with or without 5 µM BAPTA/AM or 20 µM calpain for 2 h and then exposed to 10 µM AITC for 24 h. The cells were harvested and examined for calpain activity. (C) The protein levels of calpain 1, ATF-6α, GRP78, GRP94, GADD153, and caspase-4 were determined using western blot analysis. All blots were normalized to β-actin to ensure the same amount of loading of each sample across all samples. (D) Cell viability was detected using MTT assay. *P<0.05 vs. the control and #P<0.05 vs. AITC-treated only cells; statistically significant differences were determined by ANOVA (Tukey's test). Each point represents the mean ± SD of three experiments; AITC, allyl isothiocyanate; ER, endoplasmic reticulum; ATF-6α, activating transcription factor 6α; GRP78, 78 kDa glucose-regulated protein; GRP94, 94 kDa glucose-regulated protein; GADD153, growth arrest- and DNA damage-inducible protein 153.

