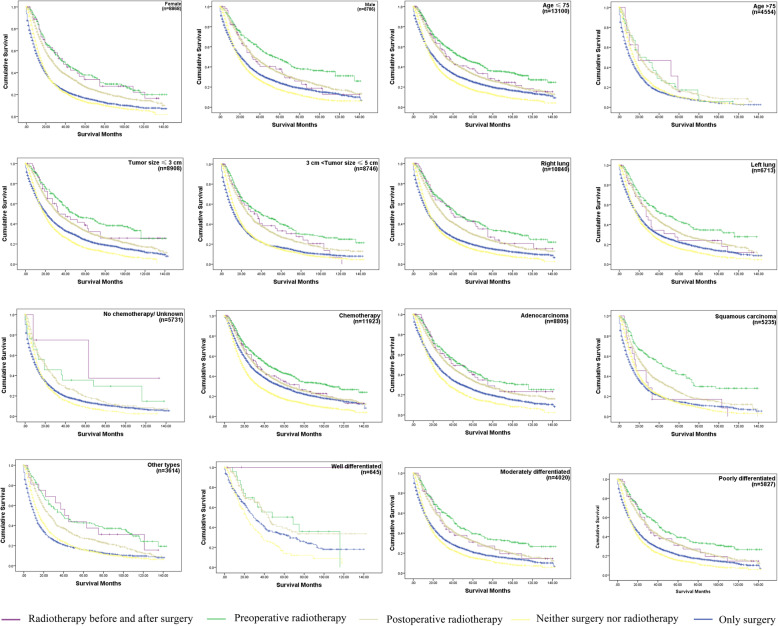
Fig. 4.
The OS curves in IIIA/N2 NSCLC subgroups with different surgery and radiotherapy combination. Log Rank p < 0.001 each subgroup. In subgroup age > 75, p- value of the OS of patients treated by preoperative radiotherapy compared to patients who underwent PORT was 0.6848. Each p-value < 0.05 in the pairwise comparison of other subgroups. Abbreviations: NSCLC, non-small cell lung cancer; IIIA/N2, stage IIIA pathologic N2; OS, Overall survival; PORT, postoperative radiotherapy. The number of patients at risk in different time periods was in Supplementary Table 1

