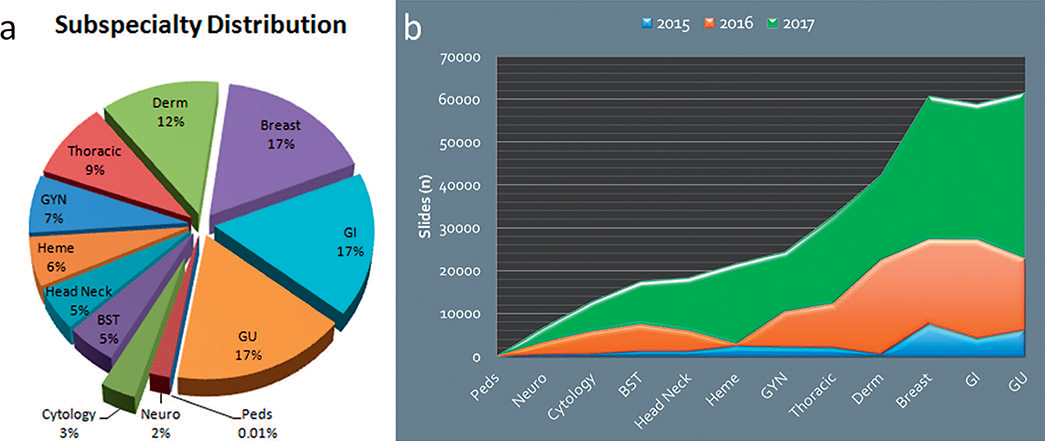
Figure 3.
Subspecialty distribution and increase in scale by subspecialty between 2015 and 2017 (n = 424 901 whole slide images [WSIs]): Peds (pediatrics; n = 39); Neuro (neuropathology; n = 8212); Cytology (n = 15 272); BST (Bone and soft tissue; n = 20 794); Head and Neck (n = 21 825); Heme (hematopathology; n = 25 728); GYN (gynecology, n = 28 954); Thoracic (n = 38 878); Derm (dermatopathology; n = 50 155); Breast (n = 72 103); GI (gastrointestinal; n = 69 920); GU (genitourinary, n = 73 021). a, At our institution, the 3 largest subspecialties with WSIs include the breast, gastrointestinal, and genitourinary pathology services. b, Increasing scale of clinical scanning across the department shows additive scanning volumes between 2015 and 2017.

