
Figure 1.
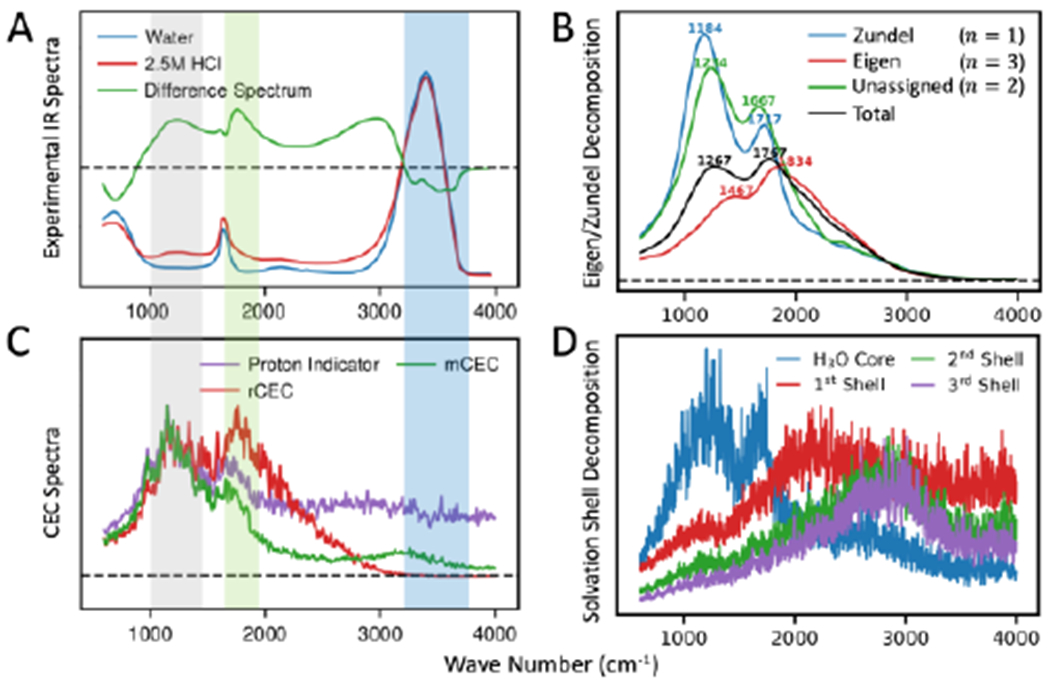
(A) Experimental IR spectrum of pure water (blue), 2.5M HCl solution (red) and their difference (green). The gray shadow highlights the PTM signal, the green shows the flanking water bending mode and the blue shows pure water stretching. (B) Decomposition of rCEC spectrum by number of unique special pairs (n). The position of peaks are denoted as wave numbers. The Zundel is defined as having one special pair (n = 1) and the Eigen is defined as having three special pairs (n = 3). The remaining case (n = 2) was not assigned to Eigen or Zundel but left independent. (C) CEC spectra computed from AIMD simulations. The rCEC spectrum (red) shows good agreement in the PTM and flanking water bending and decays to zero at the same position as experimental difference spectrum. The mCEC spectrum (green) shows non-vanishing signal at pure water stretching band. The proton indicator (purple) absorbs in the full frequency range. (D) Decomposition of rCEC spectrum by solvation shells. The absorption spectrum is blue-shifted with the increasing solvation shell.