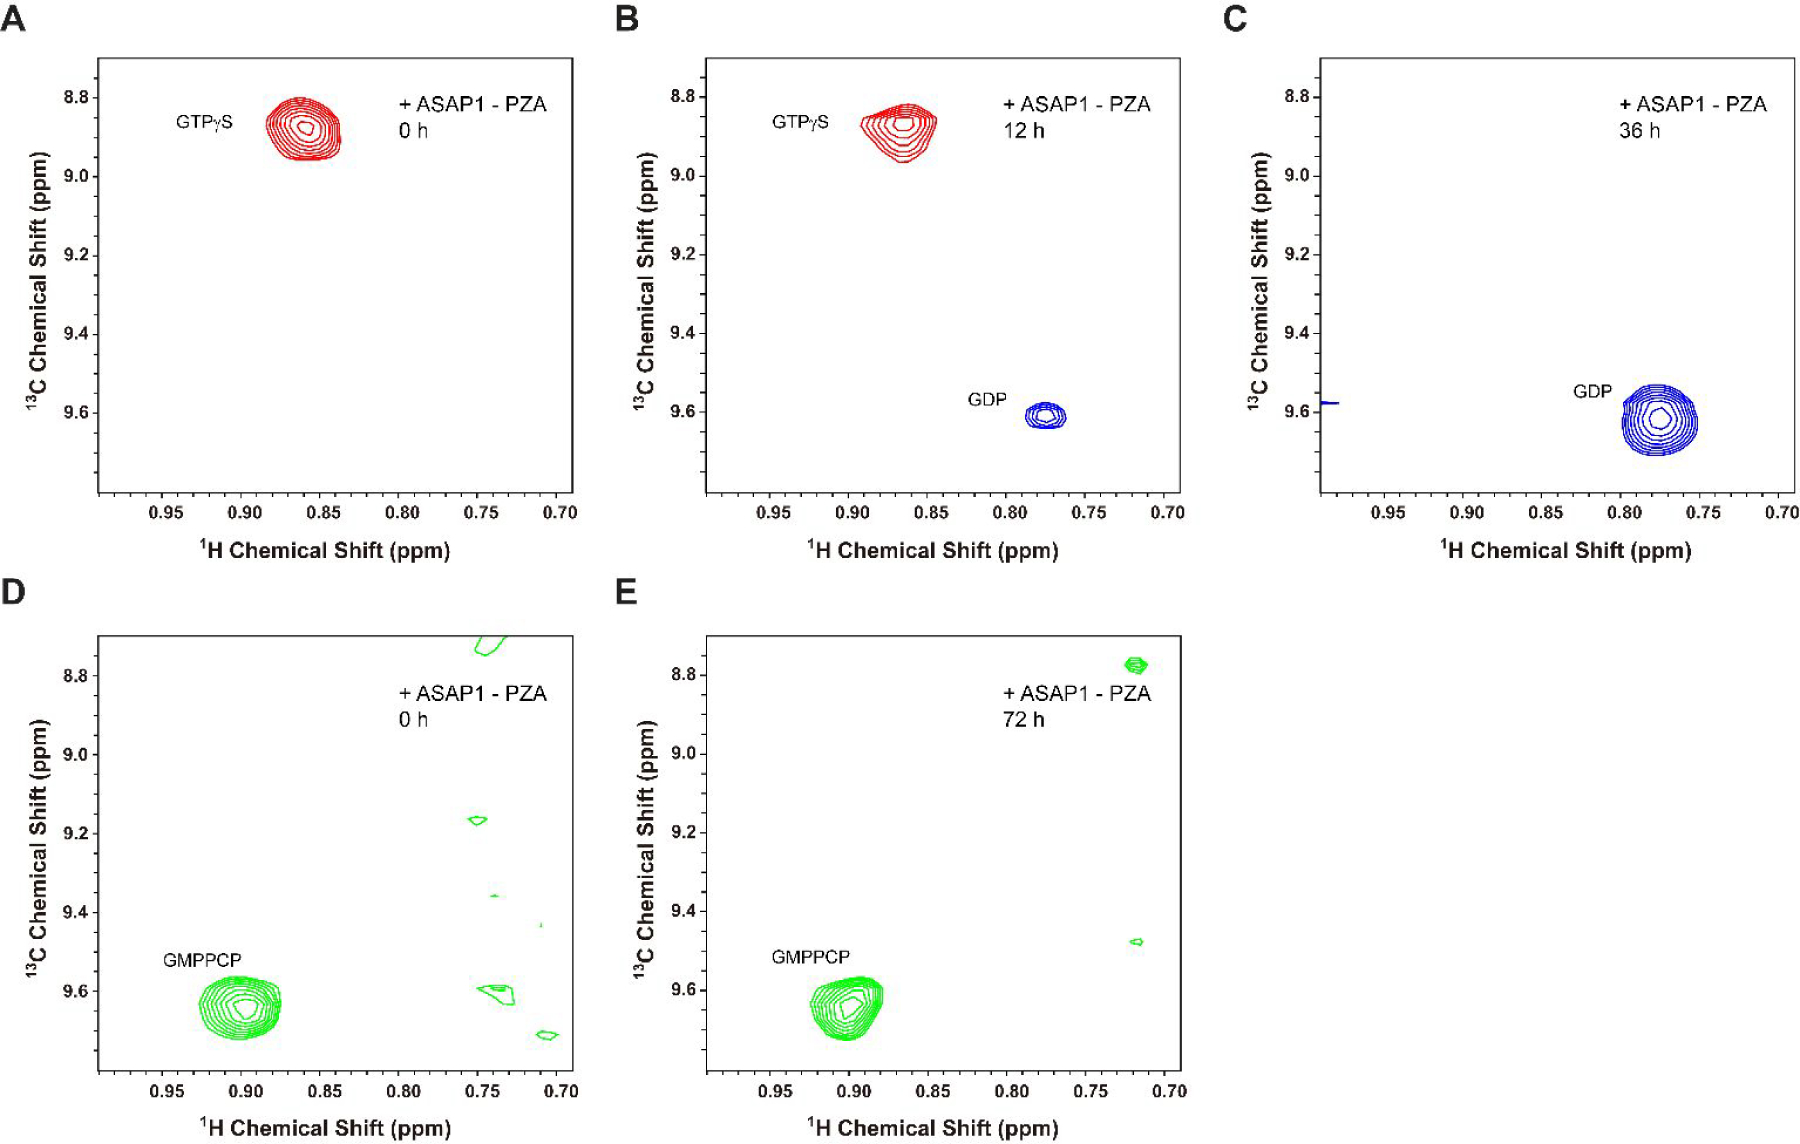
Figure 6.

The 2D 1H-13C Ile HMQC spectra of I74 in ND-anchored myrArf1-HIS:GTP bound forms. (A-C) Spectra monitoring the conversion of GTPγS to GDP using a 200 μM myrArf1ND sample buffered at 1 mM Mg2+. Data were collected before (A), 12 h (B), and 36 h (C) after 3 μM ASAP1-PZA was added. (D, E) The 2D 1H-13C Ile HMQC spectra of I74 in ND-anchored myrArf1-HIS:GMPPCP bound form buffered at 1 mM Mg2+. Using a 200 μM myrArf1-HIS:ND sample, spectra were collected before (D) and 72 h (E) after 20 μM ASAP1-PZA was added.
