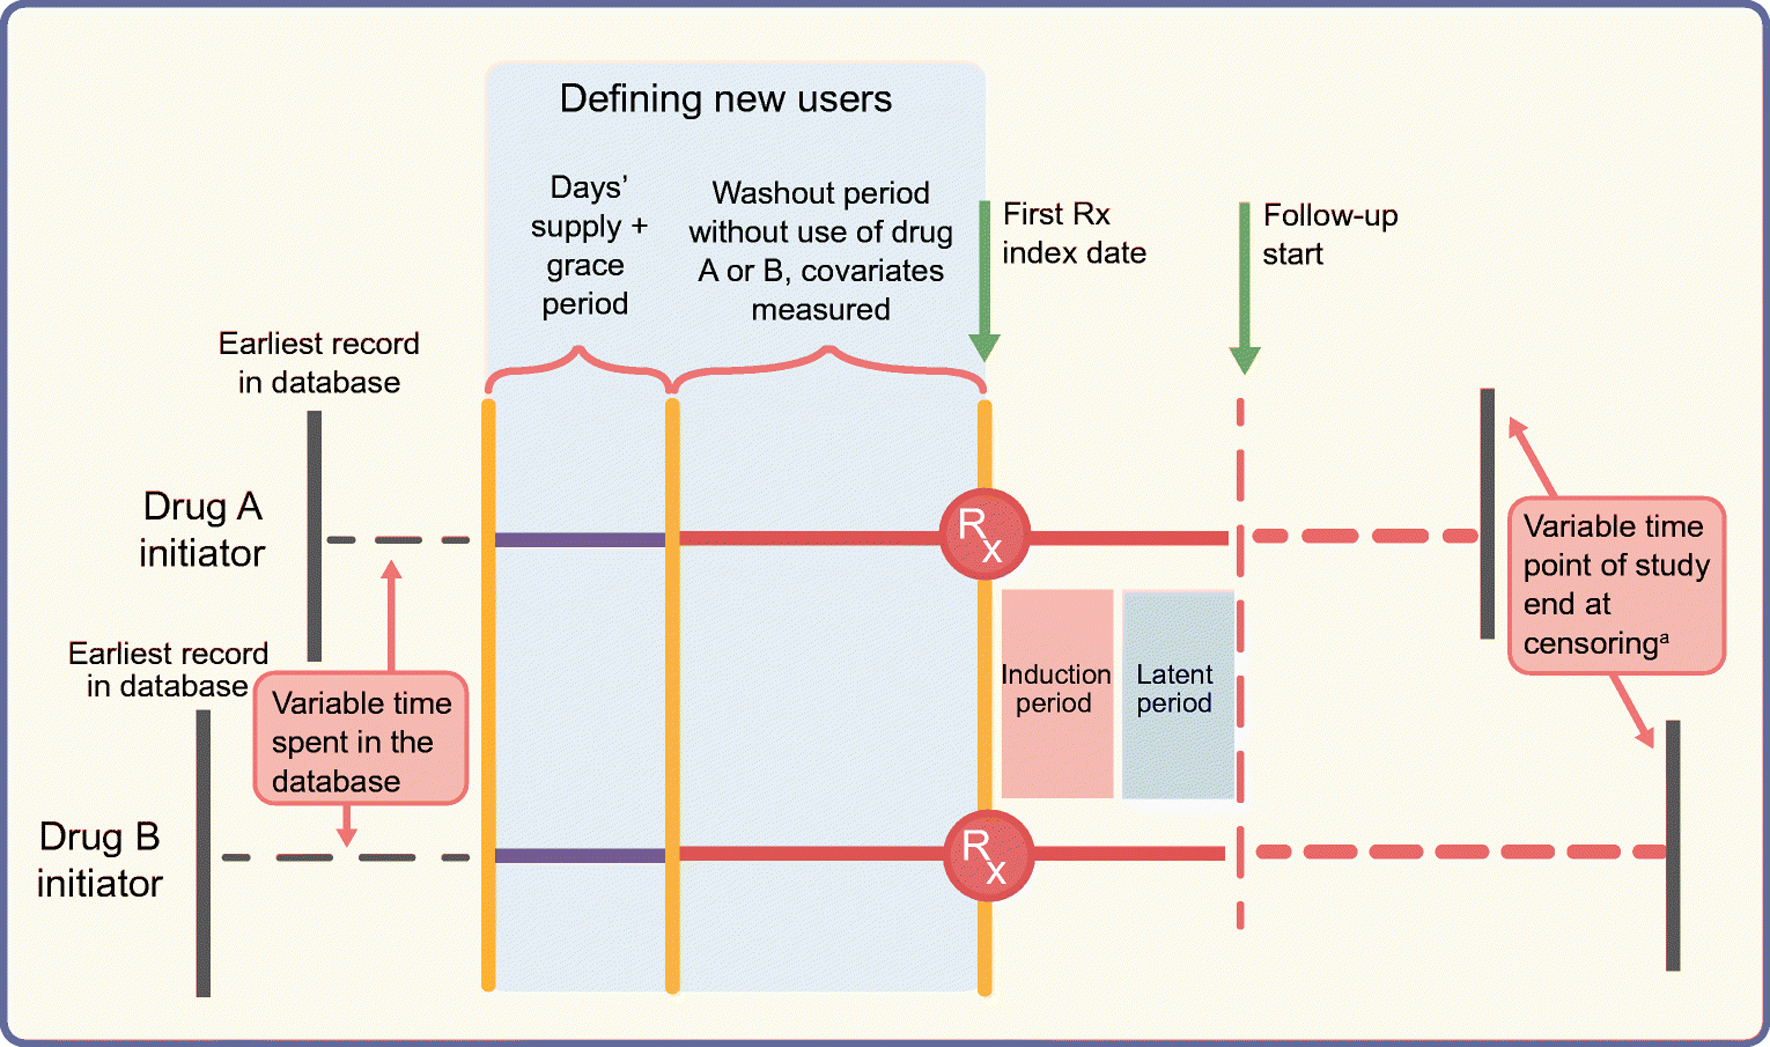
Fig. 3.

Schematic diagram of the active comparator new-user design comparing two glucose-lowering drugs. The top and bottom horizontal lines represent study timelines for initiators of drug A (e.g. DPP-4 inhibitor) and a therapeutically equivalent drug B (e.g. pioglitazone), respectively. Both groups of patients spend a variable amount of time in the database before ‘new use’ is defined. To define the new-use period for both groups, we need a predefined period equal to ‘expected days’ supply plus the grace period’ without a prescription being filled for treatment A or treatment B (indicated by solid purple lines) prior to the start of the washout period (solid orange lines). The washout period should also be free of any prescriptions for A or B and covariates are measured during this time. The index date indicates the date of the first prescription (Rx) and is followed by induction and latent periods during which person-time and outcomes are not counted. Solid red lines represent this time after the first prescription. Follow-up, indicated by the dashed red lines, starts at the end of the latent period and ends at censoring. Note that patients’ timelines for start of follow-up are intuitively synchronised by the active comparator new-user design, even though the patients can have variable start points of enrolment in the database or variable time points for end of follow-up/study end. aIf censoring is due to drug discontinuation, a predefined lag period should be considered before stopping to count outcomes and person-time. This figure is available as part of a downloadable slideset
