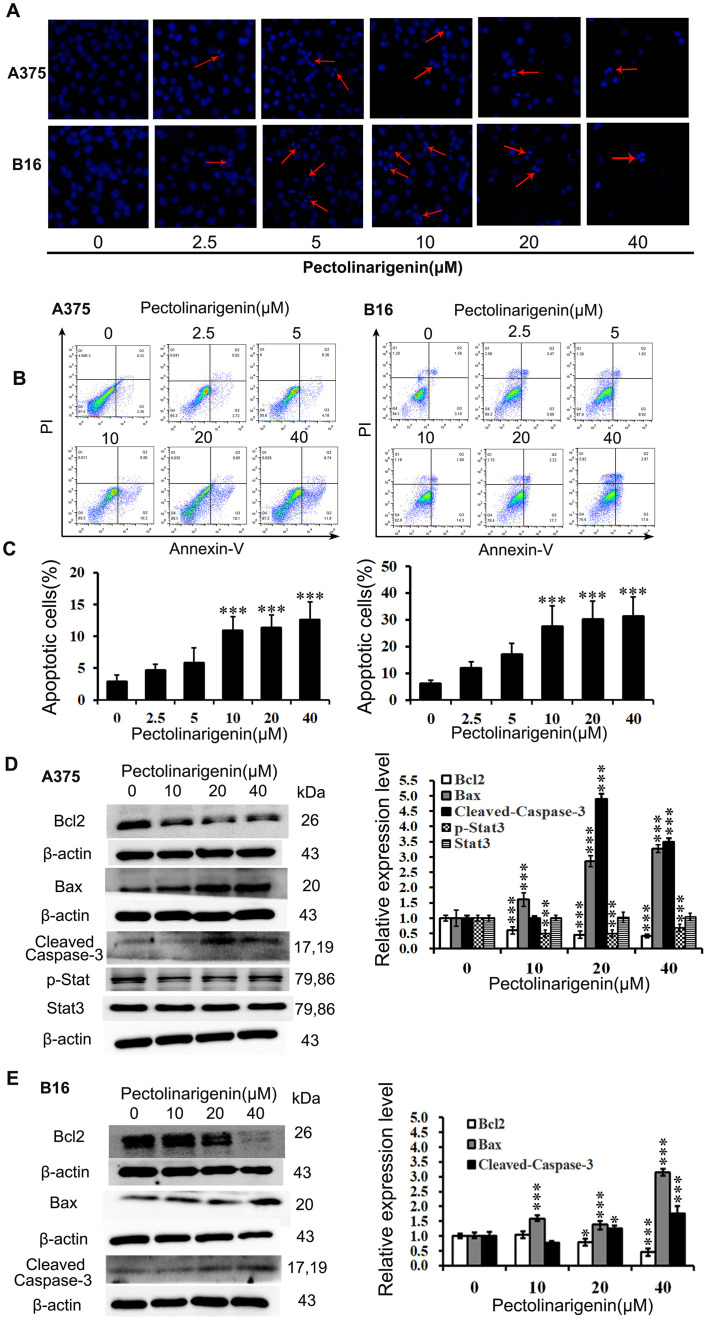
Figure 2.
Pectolinarigenin induces apoptosis in A375 and B16 cells. (A) A375 and B16 cells stained with Hoechst 33258 were observed under fluorescence microscopy (×20 magnification). Red arrows indicate bright blue regions, which represent the apoptotic bodies. (B and C) The cells were exposed to the indicated concentrations of pectolinarigenin for 48 h. Apoptosis was assessed by a flow cytometric Annexin V/PI labeling assay. (D and E) Effects of pectolinarigenin on the expression levels of apoptosis-associated proteins in A375 and B16 cells were determined by western blotting. The protein band and the loading control that follows were from the different parts of the same gel, and the loading controls and protein bands were grouped together in the figure from different gels. Data are presented as the mean ± SD of at least three independent experiments. *P<0.05 and ***P<0.001 vs. 0 µM pectolinarigenin. PI, propidium iodide.

