
Figure 4.
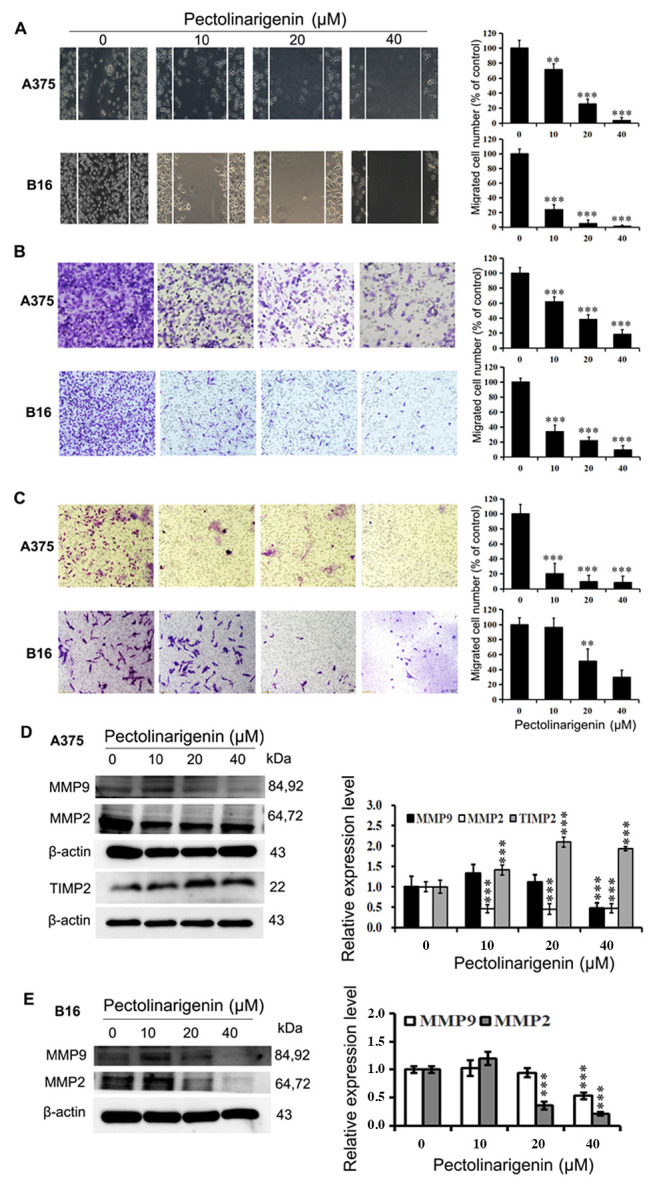
Pectolinarigenin decreases A375 and B16 cell migration and invasion. (A) Representative images from a light microscope (×10 magnification) of the wound healing assay using A375 and B16 cells treated with pectolinarigenin for 48 h; The lines represent the area occupied by the initial scraping, and migrated cells were counted. (B) Transwell migration assay of A375 and B16 cells upon treatment with the indicated concentration of pectolinarigenin, after which the migrated cells were stained, photographed and quantified (×20 magnification). (C) Transwell invasion assay of A375 and B16 cells upon treatment with the indicated concentration of pectolinarigenin, after which the invading cells were stained, photographed and quantified (×20 magnification). (D and E) Expression of MMP2, MMP9, and TIMP2 were determined by western blotting with β-actin as the internal control. The protein band and the loading control that follows were from the different parts of the same gel, and the loading controls and protein bands were grouped together in the figure from different gels. Data are presented as the means ± SD of at least three independent experiments. **P<0.01 and ***P<0.001 vs. 0 µM pectolinarigenin. MMP, matrix metalloproteinase; TIMP2, tissue inhibitor or metalloproteinases 2; p, phosphorylated.