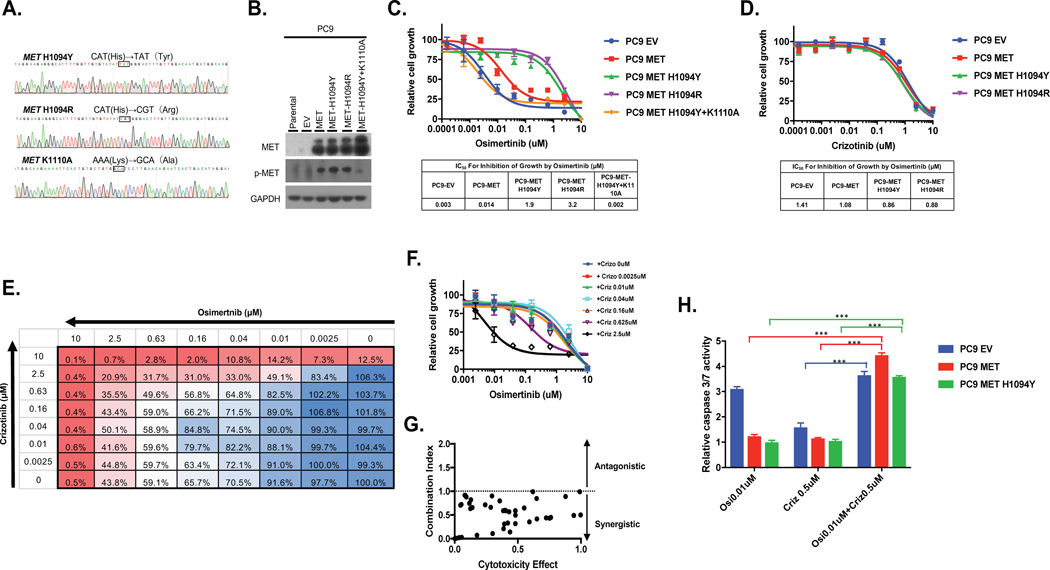
Figure 6. Combined inhibition of MET and EGFR overcomes MET-H1094-mediated osimertinib resistance.
A, MET-H1094 mutations were introduced by site-directed mutagenesis and confirmed by Sanger sequencing. B, Plasmids containing the MET mutants were stably introduced into PC9 cells via lentiviral transduction and then expression of MET confirmed by Western blotting. C and D, Isogenic PC9 cells were treated with osimertinib, C, or crizotinib, D, for 96 h and then growth determined using alamarBlue viability dye (top panel). IC50 values were determined by non-linear regression analysis using GraphPad Prism (bottom panel). E-G, Cells were treated with the indicated combined concentrations of osimertinib and crizotinib for 96 h and then growth determined. E and F, The percent inhibition of growth at each drug combination. G, The Chou-Talalay method was used to examine whether crizotinib and osimertinib inhibited growth in a synergistic manner. The dot plot shows the combination index (CI) as a function of the fraction affected. CI<1 indicates synergy between the two inhibitors. H, Caspase 3/7 activity was determined in cells treated for 48 h with the indicated inhibitors for 48 h and then caspase 3/7 activity determined. Results represent the fold change in caspase 3/7 enzymatic activity above the corresponding untreated cells. All experiments were repeated 3 times and included triplicate determinations of each condition. EV: empty vector. The K110A mutation results in an inactive kinase. Results represent the mean ± SD. *p<0.05 **p<0.01, ***p<0.001.

