
Figure 2:
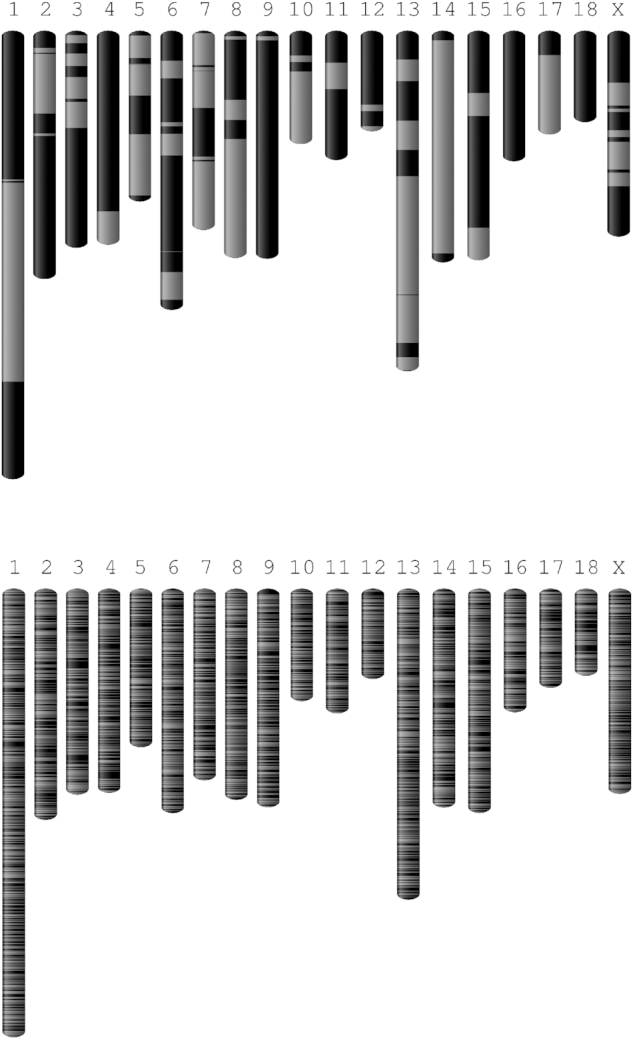
Visualization of improvements in assembly contiguity. Graphical visualization of contigs for Sscrofa11 (top) and Sscrofa10.2 (bottom) as alternating dark and light grey bars.
Official websites use .gov
A
.gov website belongs to an official
government organization in the United States.
Secure .gov websites use HTTPS
A lock (
) or https:// means you've safely
connected to the .gov website. Share sensitive
information only on official, secure websites.
Visualization of improvements in assembly contiguity. Graphical visualization of contigs for Sscrofa11 (top) and Sscrofa10.2 (bottom) as alternating dark and light grey bars.