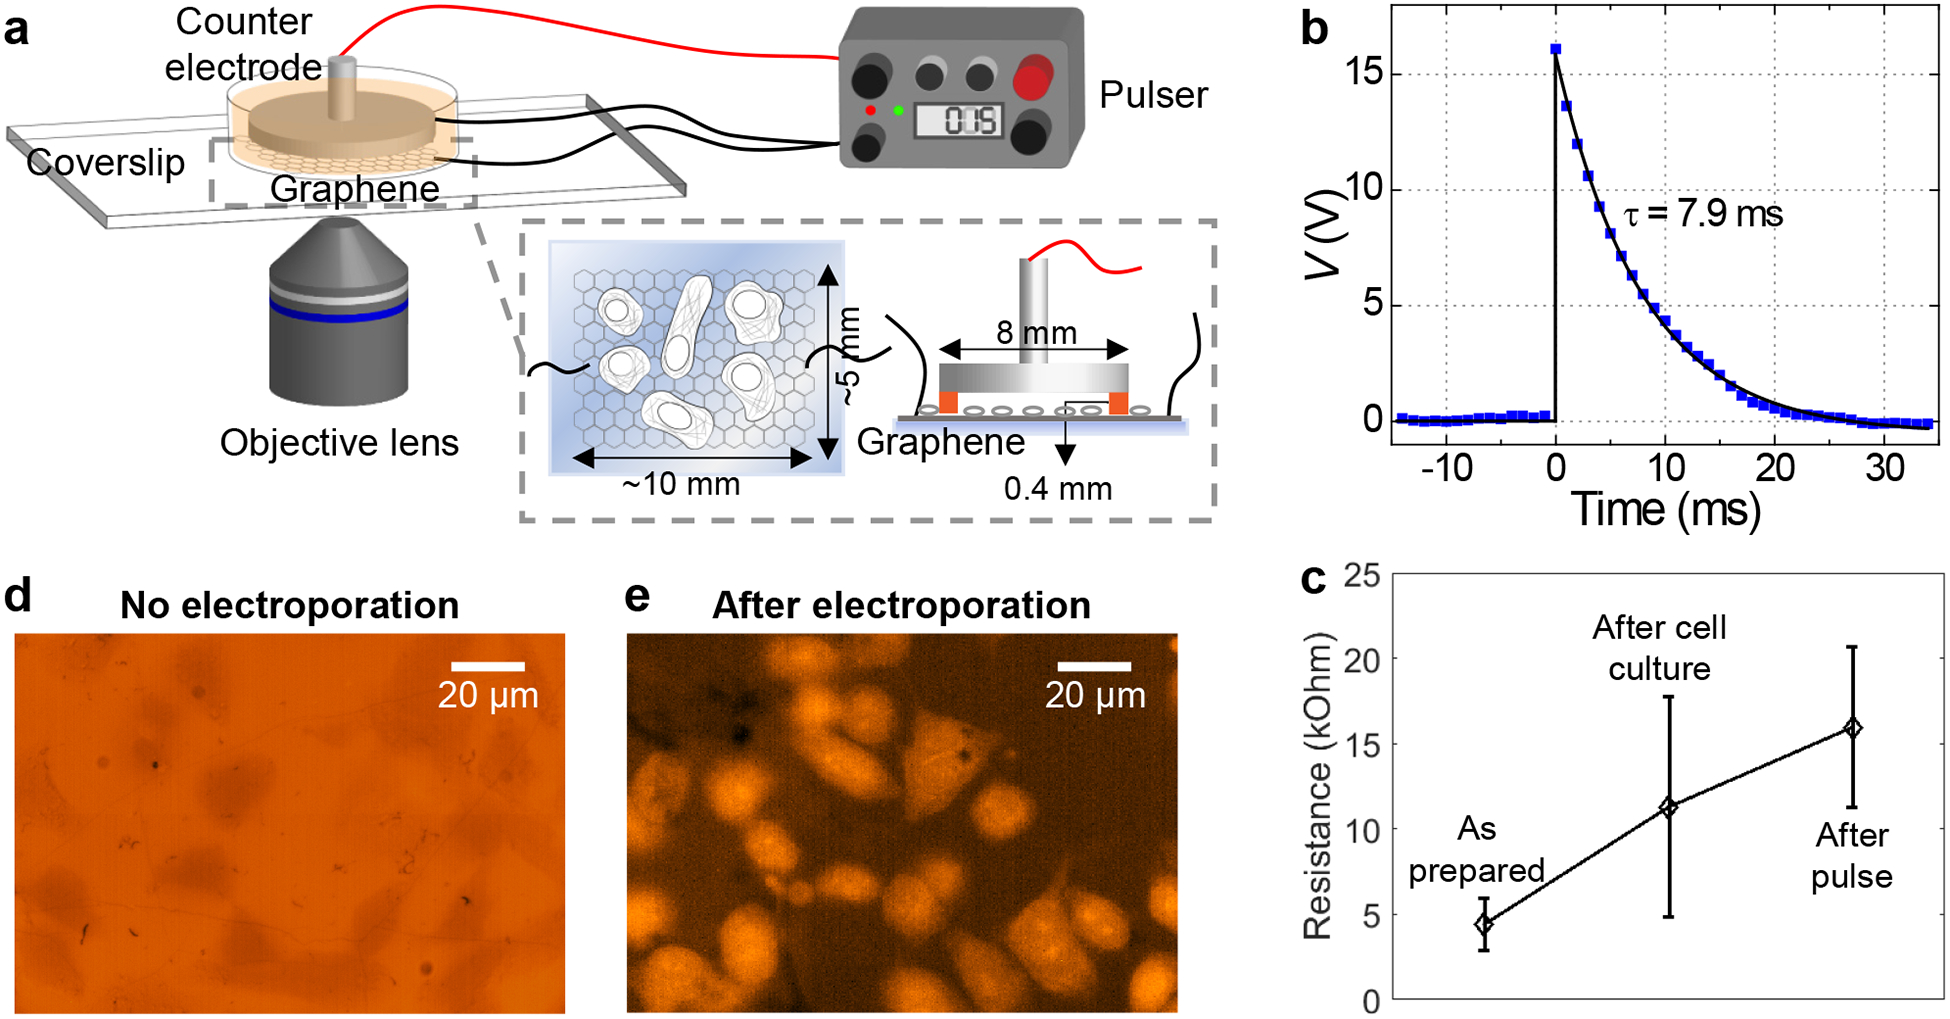
Figure 1.

Electroporation of adherent cells on a graphene-covered glass coverslip. (a) Schematic of the experimental setup. (b) A representative pulse shape, as measured from an oscilloscope. (c) Measured two-point resistance of graphene for the as-prepared device, after culturing of adherent cells, and after electroporation (N = 4 measured devices). Error bars: standard deviation between samples. (d) Fluorescence micrograph of PtK2 cells incubated in an SR101-containing medium for 10 minutes; cells appear as darker regions due to the physical exclusion of the dye. (e) Fluorescence micrograph of PtK2 cells on graphene after the application of the voltage pulse, 10 min incubation, and wash-out of free dyes.
