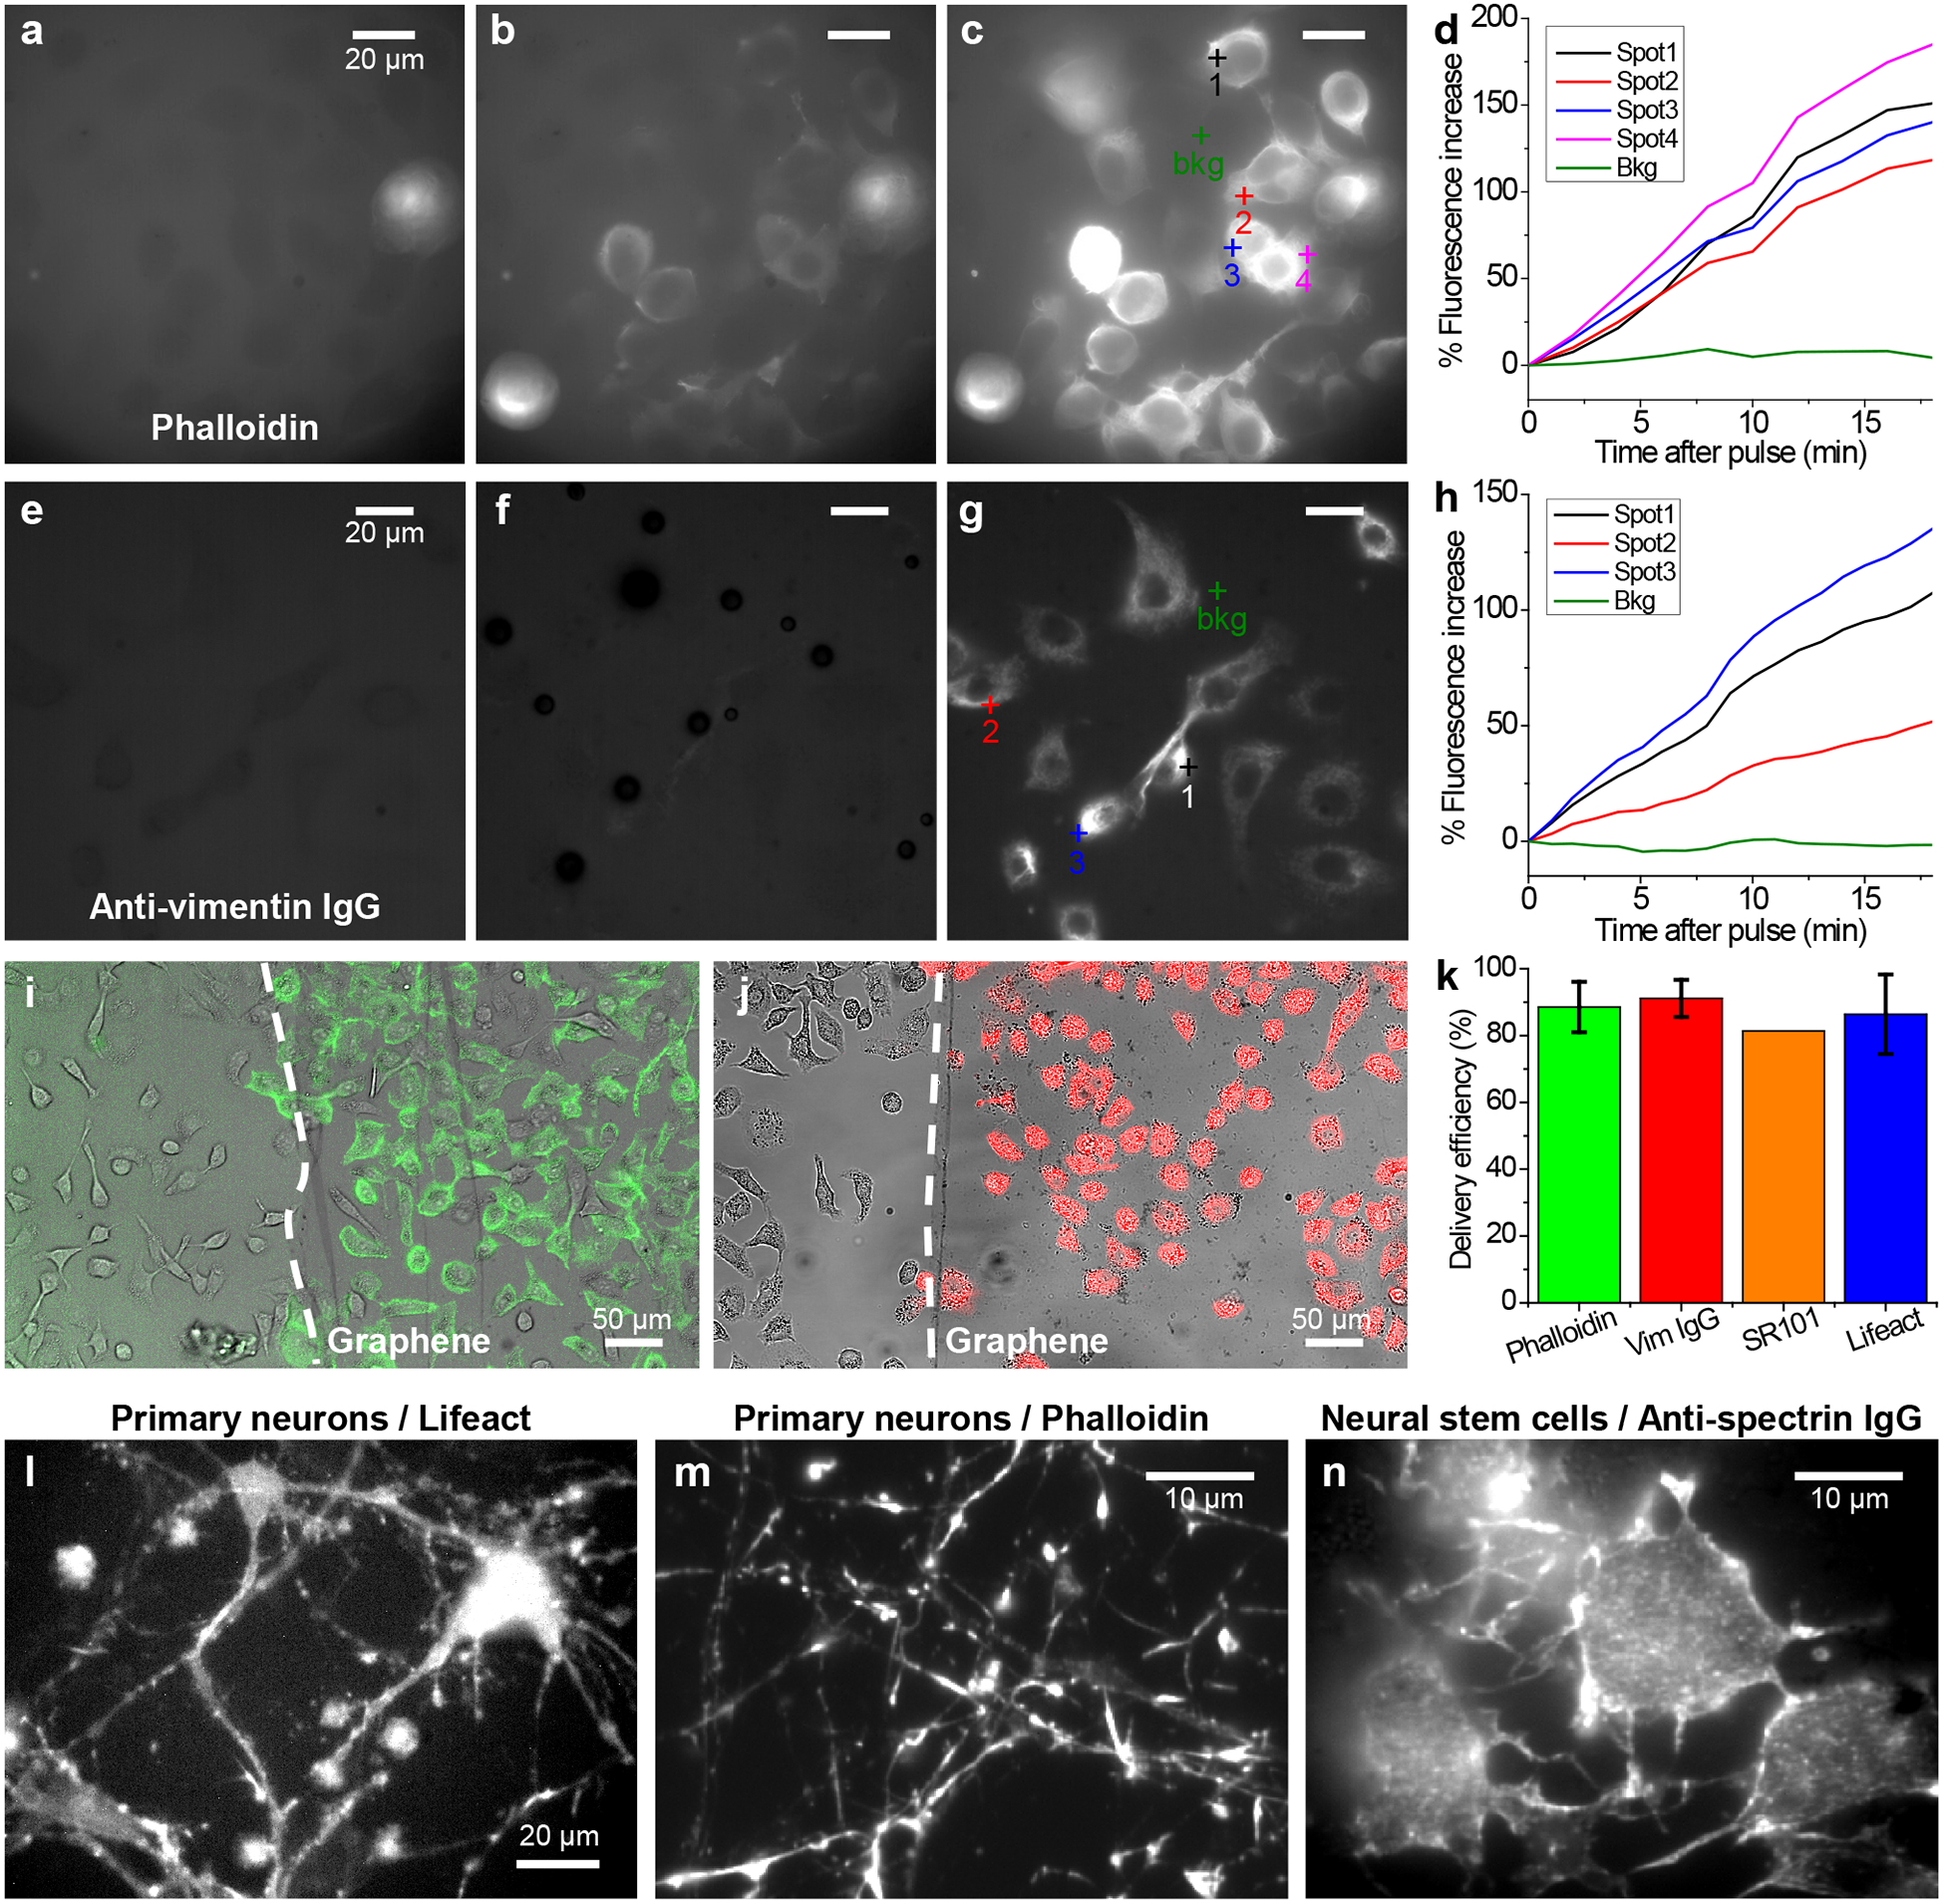
Figure 2.

Delivery of dye-tagged probes that bind to specific intracellular targets. (a-c) Delivery of phalloidin-AF488 into A549 cells through graphene electroporation. (a) Fluorescence micrograph of the sample before the application of the voltage pulse. (b,c) Fluorescence micrographs for the same area 1 min (b) and 20 min (c) after the voltage pulse. (d) Change in local fluorescence intensity over time after the voltage pulse, for the different spots marked in (c). (e-g) Delivery of AF647-conjugated anti-vimentin full IgG antibody into A549 cells. (e) Fluorescence micrograph before the voltage pulse. (f,g) Fluorescence micrographs for the same area 1 min (f) and 20 min (g) after the voltage pulse. (h) Change in local fluorescence intensity over time after the voltage pulse, for the different spots marked in (g). (i) Merged transmission (grayscale) and fluorescence (green) micrographs for the spatially controlled delivery of phalloidin in A549 cells adhered to graphene (to the right of the dashed line) vs. no delivery to cells on the bare glass surface without graphene (left of the dashed line). (j) Similar results for the spatially controlled delivery of anti-vimentin IgG (red). (k) Percentage of cells being labeled for phalloidin (N = 7 devices), anti-vimentin IgG (N = 4 devices), SR101 (N = 1 device), and Lifeact (N = 4 devices), as determined from correlated transmission and fluorescence micrographs. Error bars: standard deviation between samples. (l,m) Fluorescence micrographs for the graphene-electroporation delivery of Lifeact-Cy5 (l) and phalloidin-AF647 (m) into primary hippocampal neurons that were cultured in graphene devices for 14 days. (n) Delivery of CF647-conjugated anti-spectrin IgG into primary neural stem cells that have been differentiating in a graphene device for 3 days.
