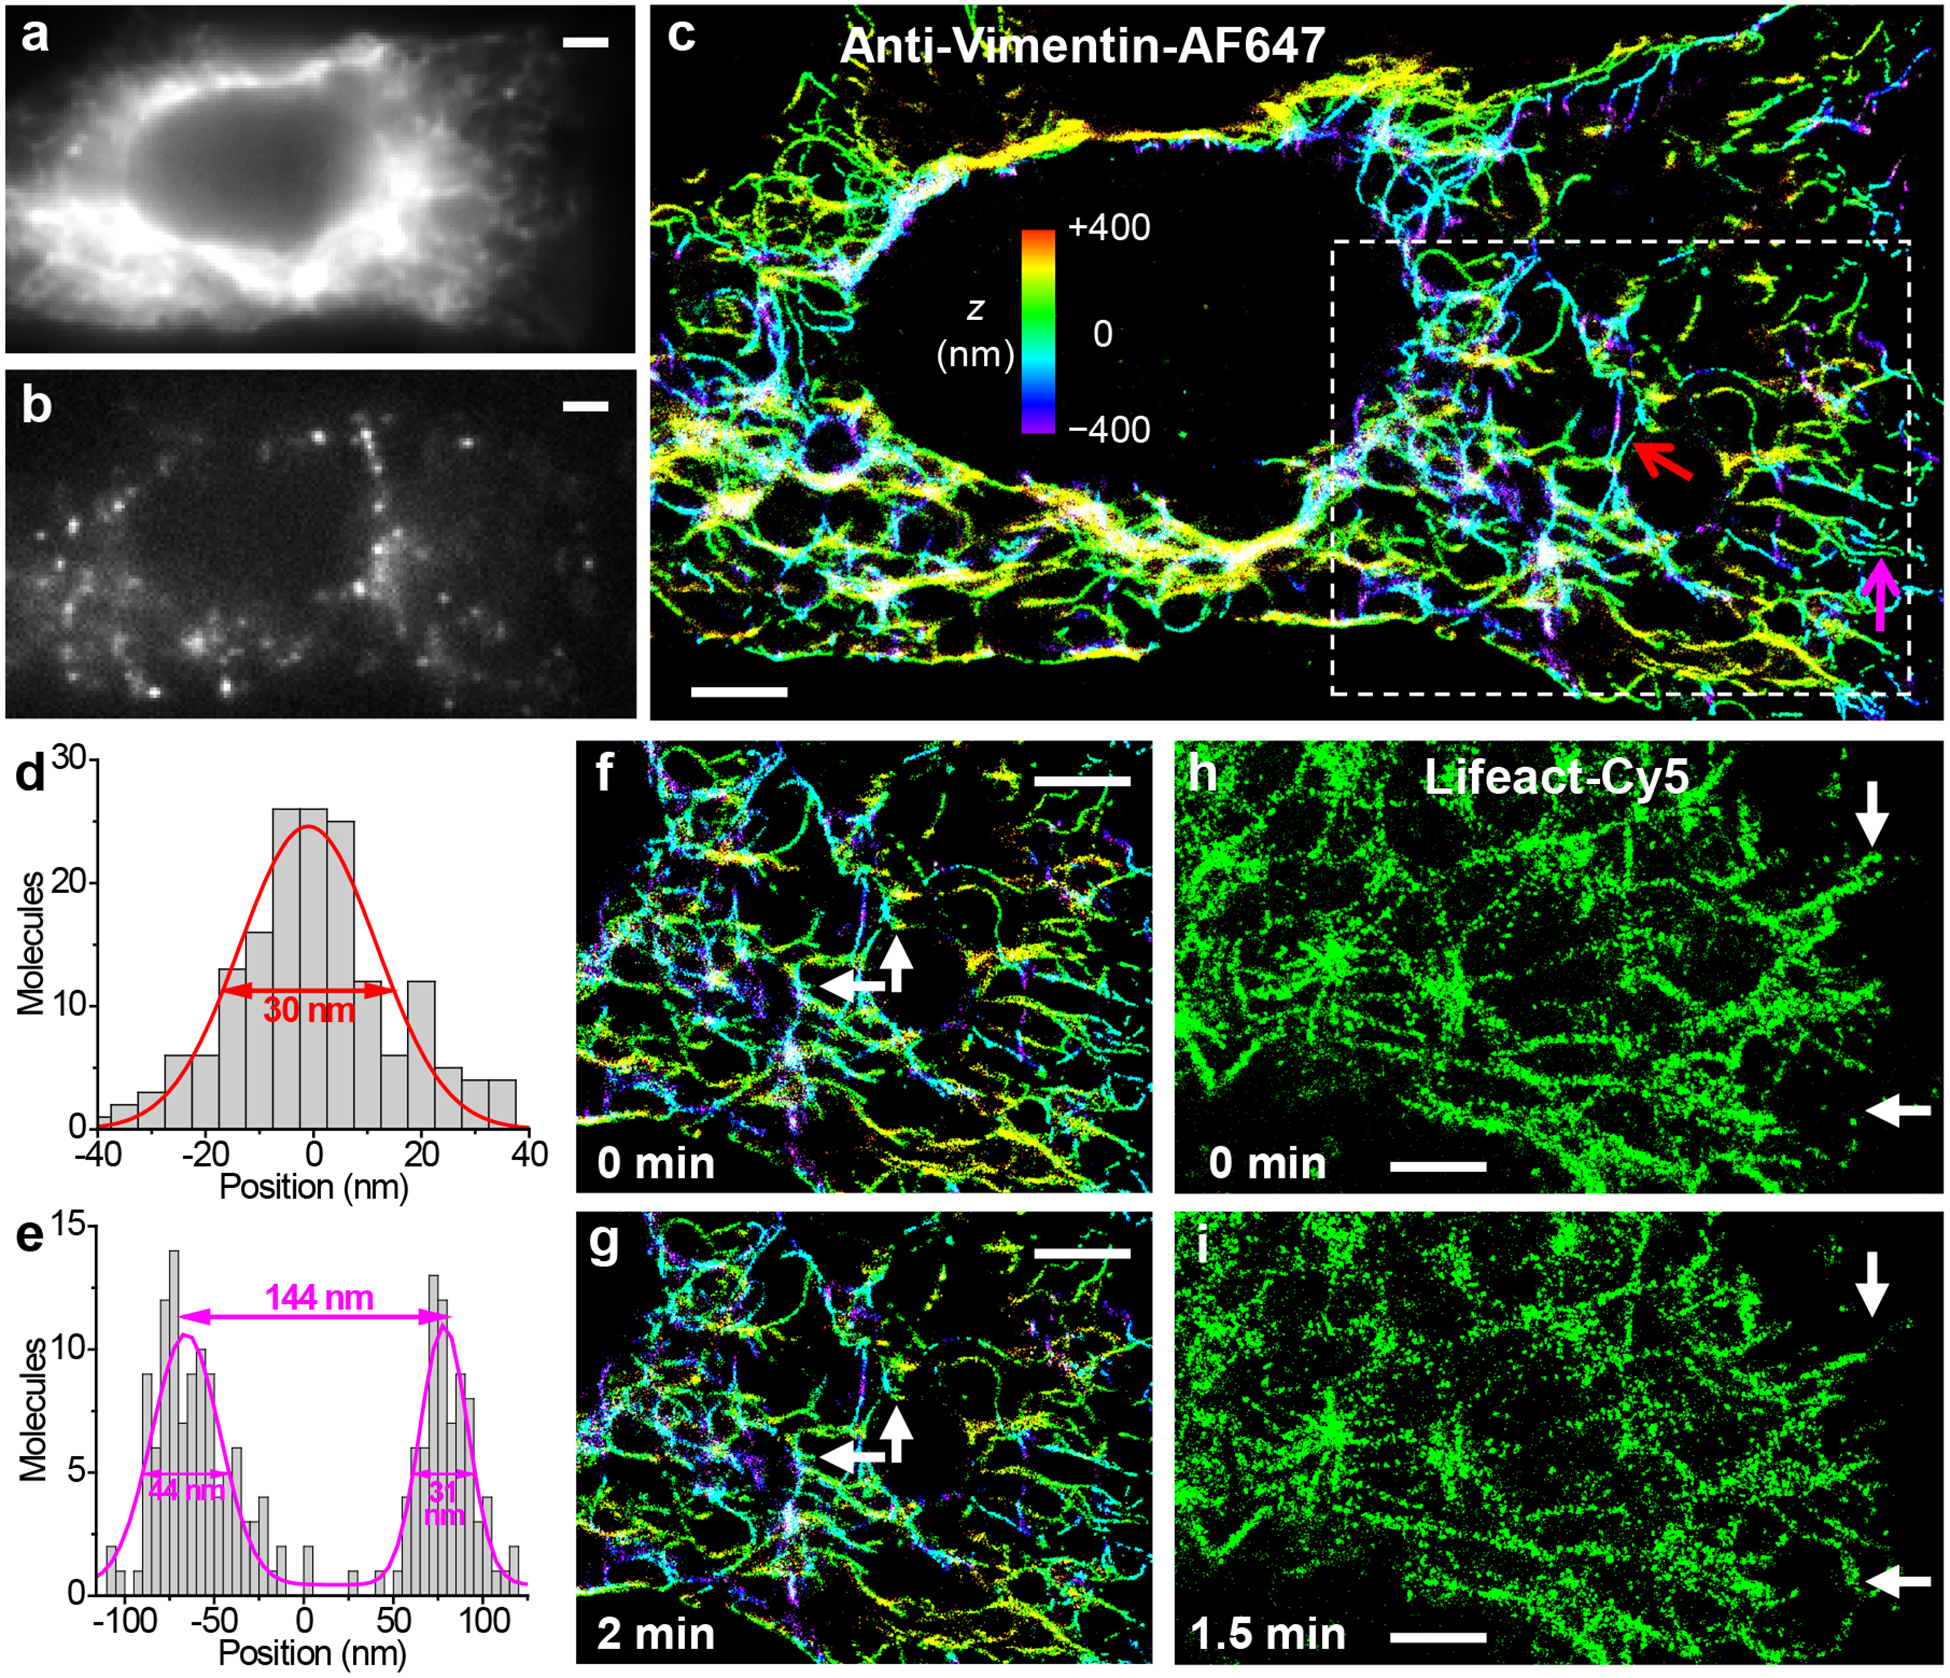
Figure 3.

In situ live-cell STORM SRM through fluorescent probes delivered by graphene electroporation. (a) Diffraction-limited image of vimentin in a live A549 cell labeled through the graphene-electroporation delivery of an AF647-tagged IgG antibody. (b) A typical frame of single-molecule images during STORM acquisition. (c) Resultant 3D-STORM image. Color presents the depth (z) information (color scale bar). (d) Cross-sectional profile of the single vimentin filament pointed to by the red arrow in (c). Fit to a normal distribution gave FWHM of 30 nm. (e) Cross-sectional profile for two adjacent filaments pointed to by the magenta arrow in (c). (f,g) A sequence of two STORM images at 0 min (f) and 2 min (g). Arrows point to structural changes at the nanoscale. (h,i) A sequence of two STORM images of actin filaments in a live A549 cell labeled through the graphene-electroporation delivery of Lifeact-Cy5, at 0 min (h) and 1.5 min (i). Arrows point to notable structural changes. Scale bars: 2 μm.
