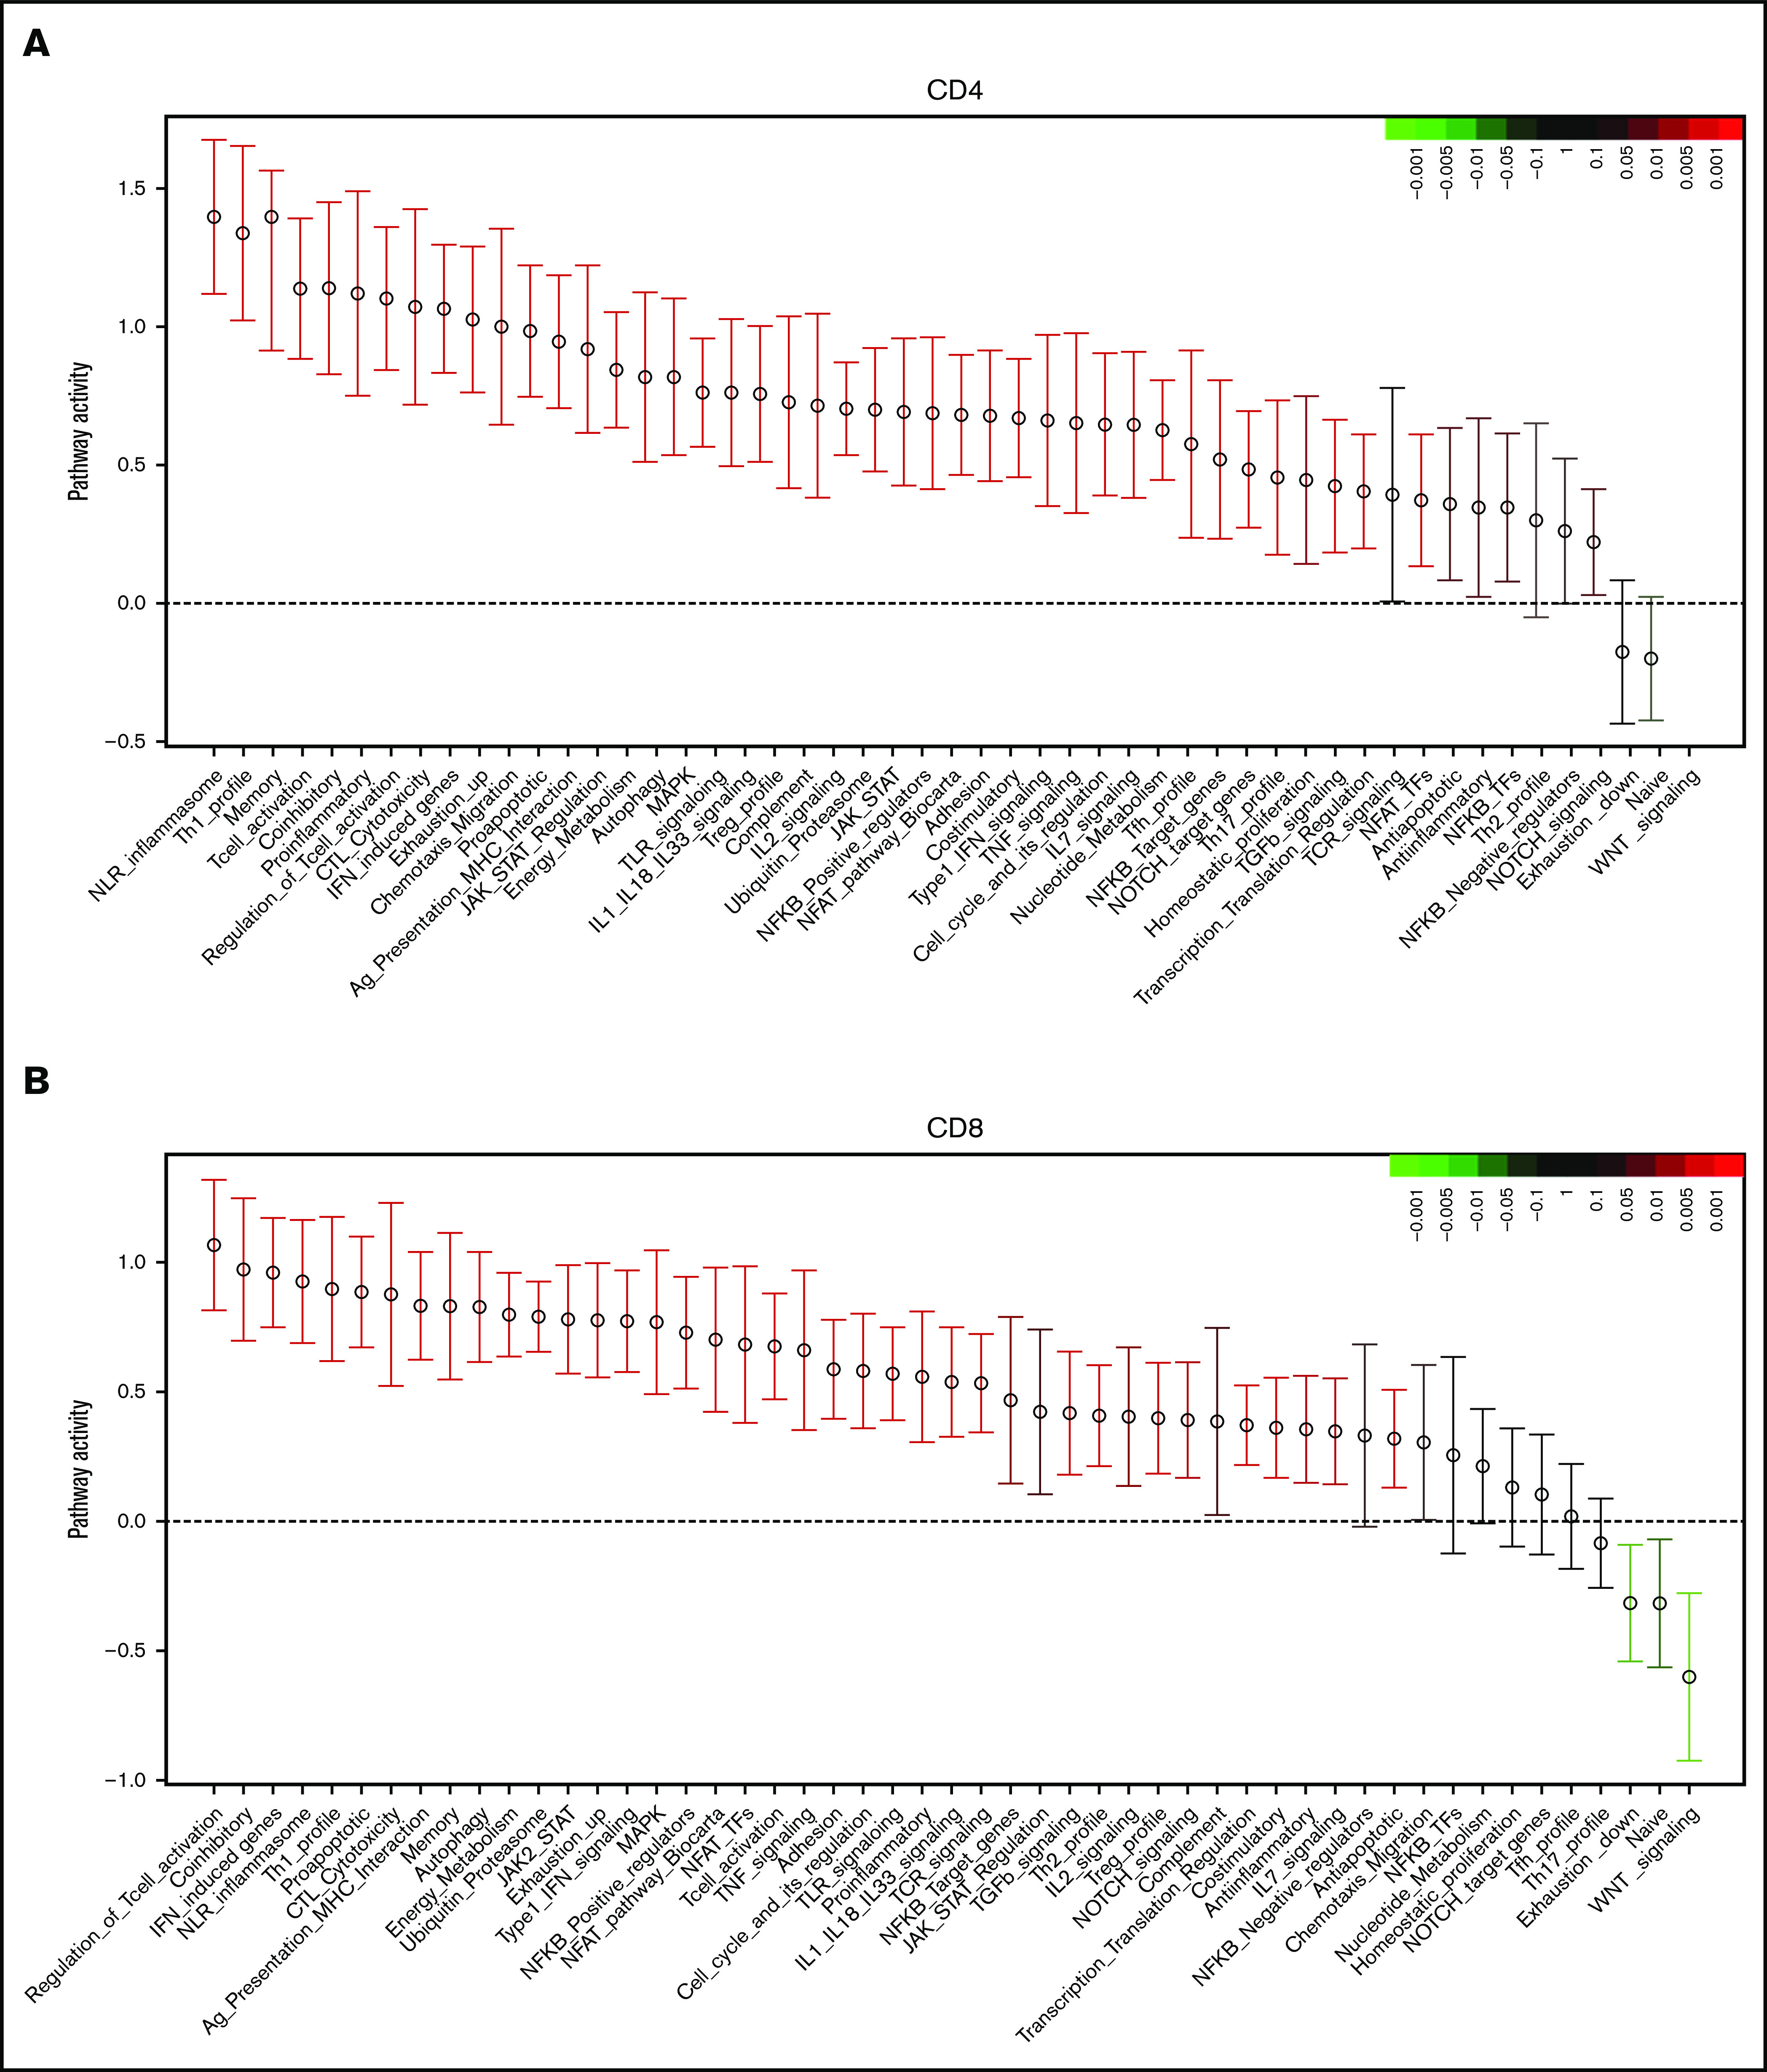
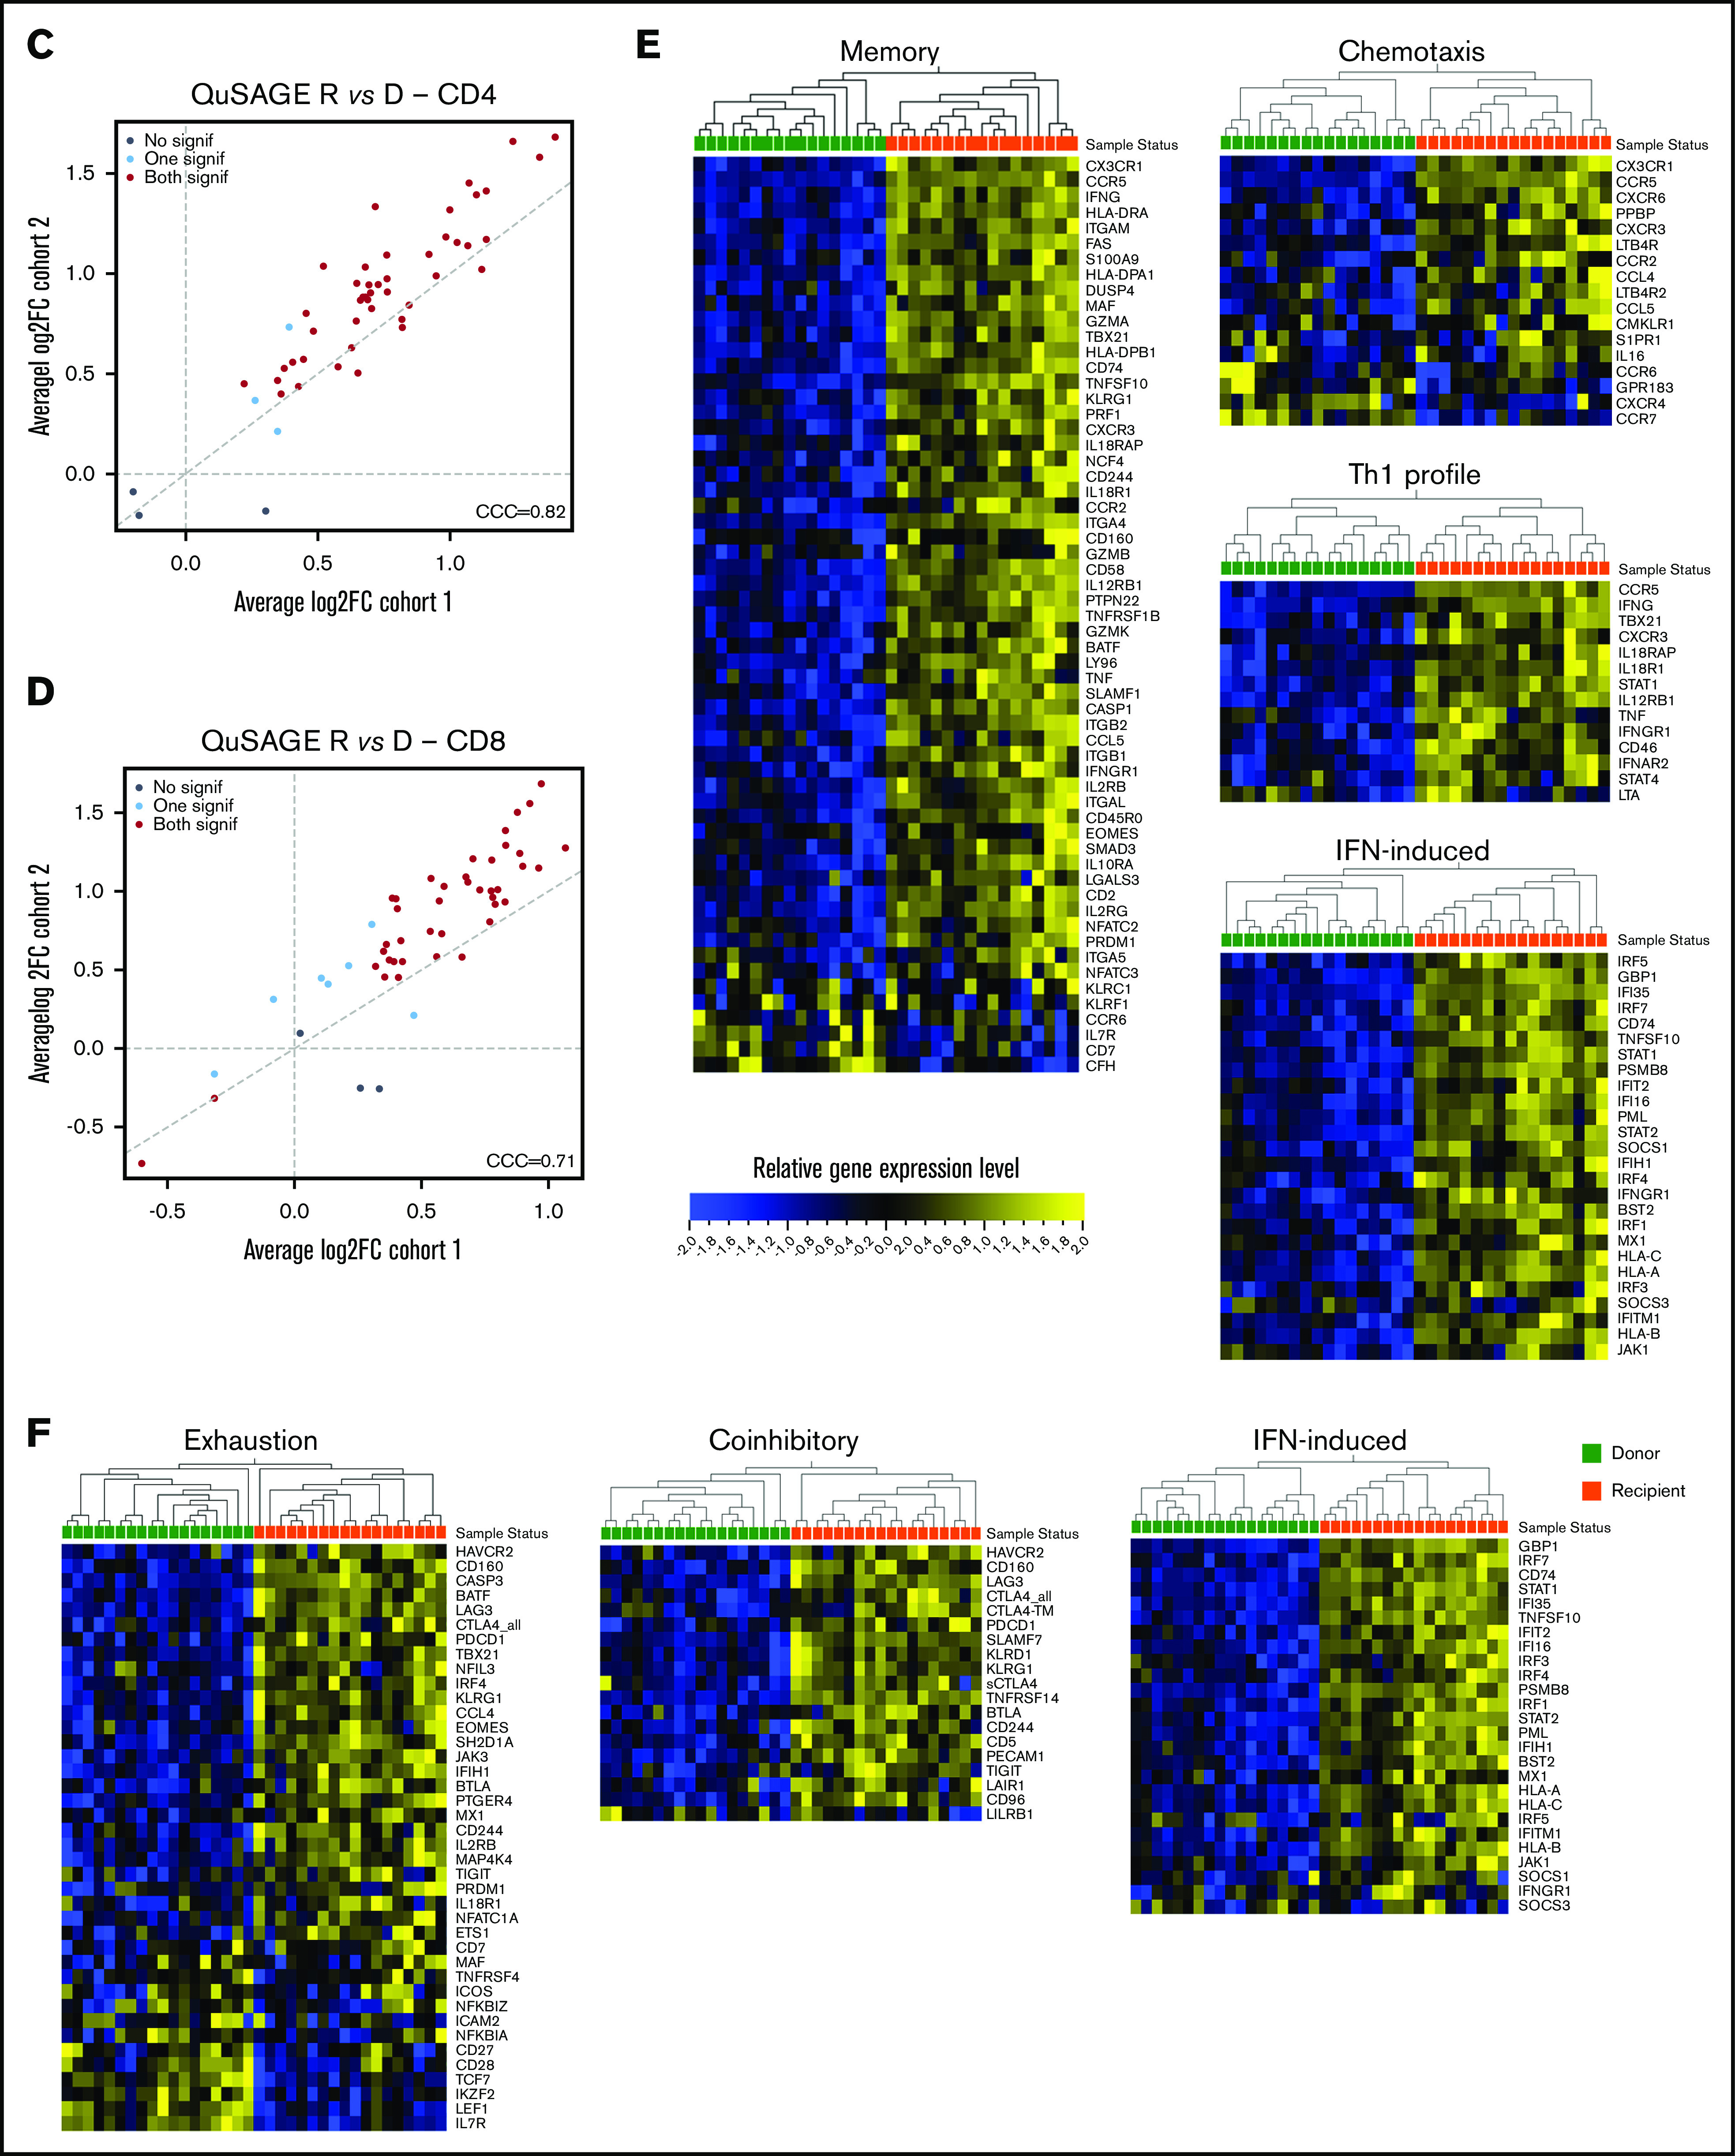
Figure 3.


Molecular signature of T cells in recipients without aGVHD after HCT compared with their donors. QuSAGE of CD4+ (A) and CD8+ (B) T-cell gene-expression profiles in recipients at day 90 post-HCT compared with their respective donors before transplant in cohort 1. For each pathway, the mean fold change and the 95% confidence intervals are plotted and color-coded according to their FDR-corrected P values compared with 0. Red and green bars indicate a statistically significant increased or decreased pathway activity, respectively, in recipients compared with donors. Correlation between cohorts 1 and 2 for QuSAGE in CD4+ (C) and CD8+ (D) T cells. Red dots correspond to modules significantly enriched (FDR ≤ 0.05) in both cohorts, blue dots correspond to modules enriched in only 1 cohort, and black dots correspond to modules not enriched. The concordance correlation coefficient (CCC) is displayed to quantify the reproducibility of the results between the 2 cohorts. Relative gene-expression levels of genes in selected enriched modules in recipients at day 90 post-HCT compared with their respective donors before transplant in cohort 1 in CD4+ (E) and CD8+ (F) T cells. In the heat maps, columns represent samples and are ordered by hierarchical clustering, whereas rows represent genes and are ranked by fold change. Yellow indicates high levels of expression, and blue indicates low levels of expression. Ag, antigen; CTL, cytotoxic T lymphocyte; MHC, major histocompatibility complex; TCR, T-cell receptor; TF, transcription factor; TGF, transforming growth factor; TLR, Toll-like receptor; TNF, tumor necrosis factor.
