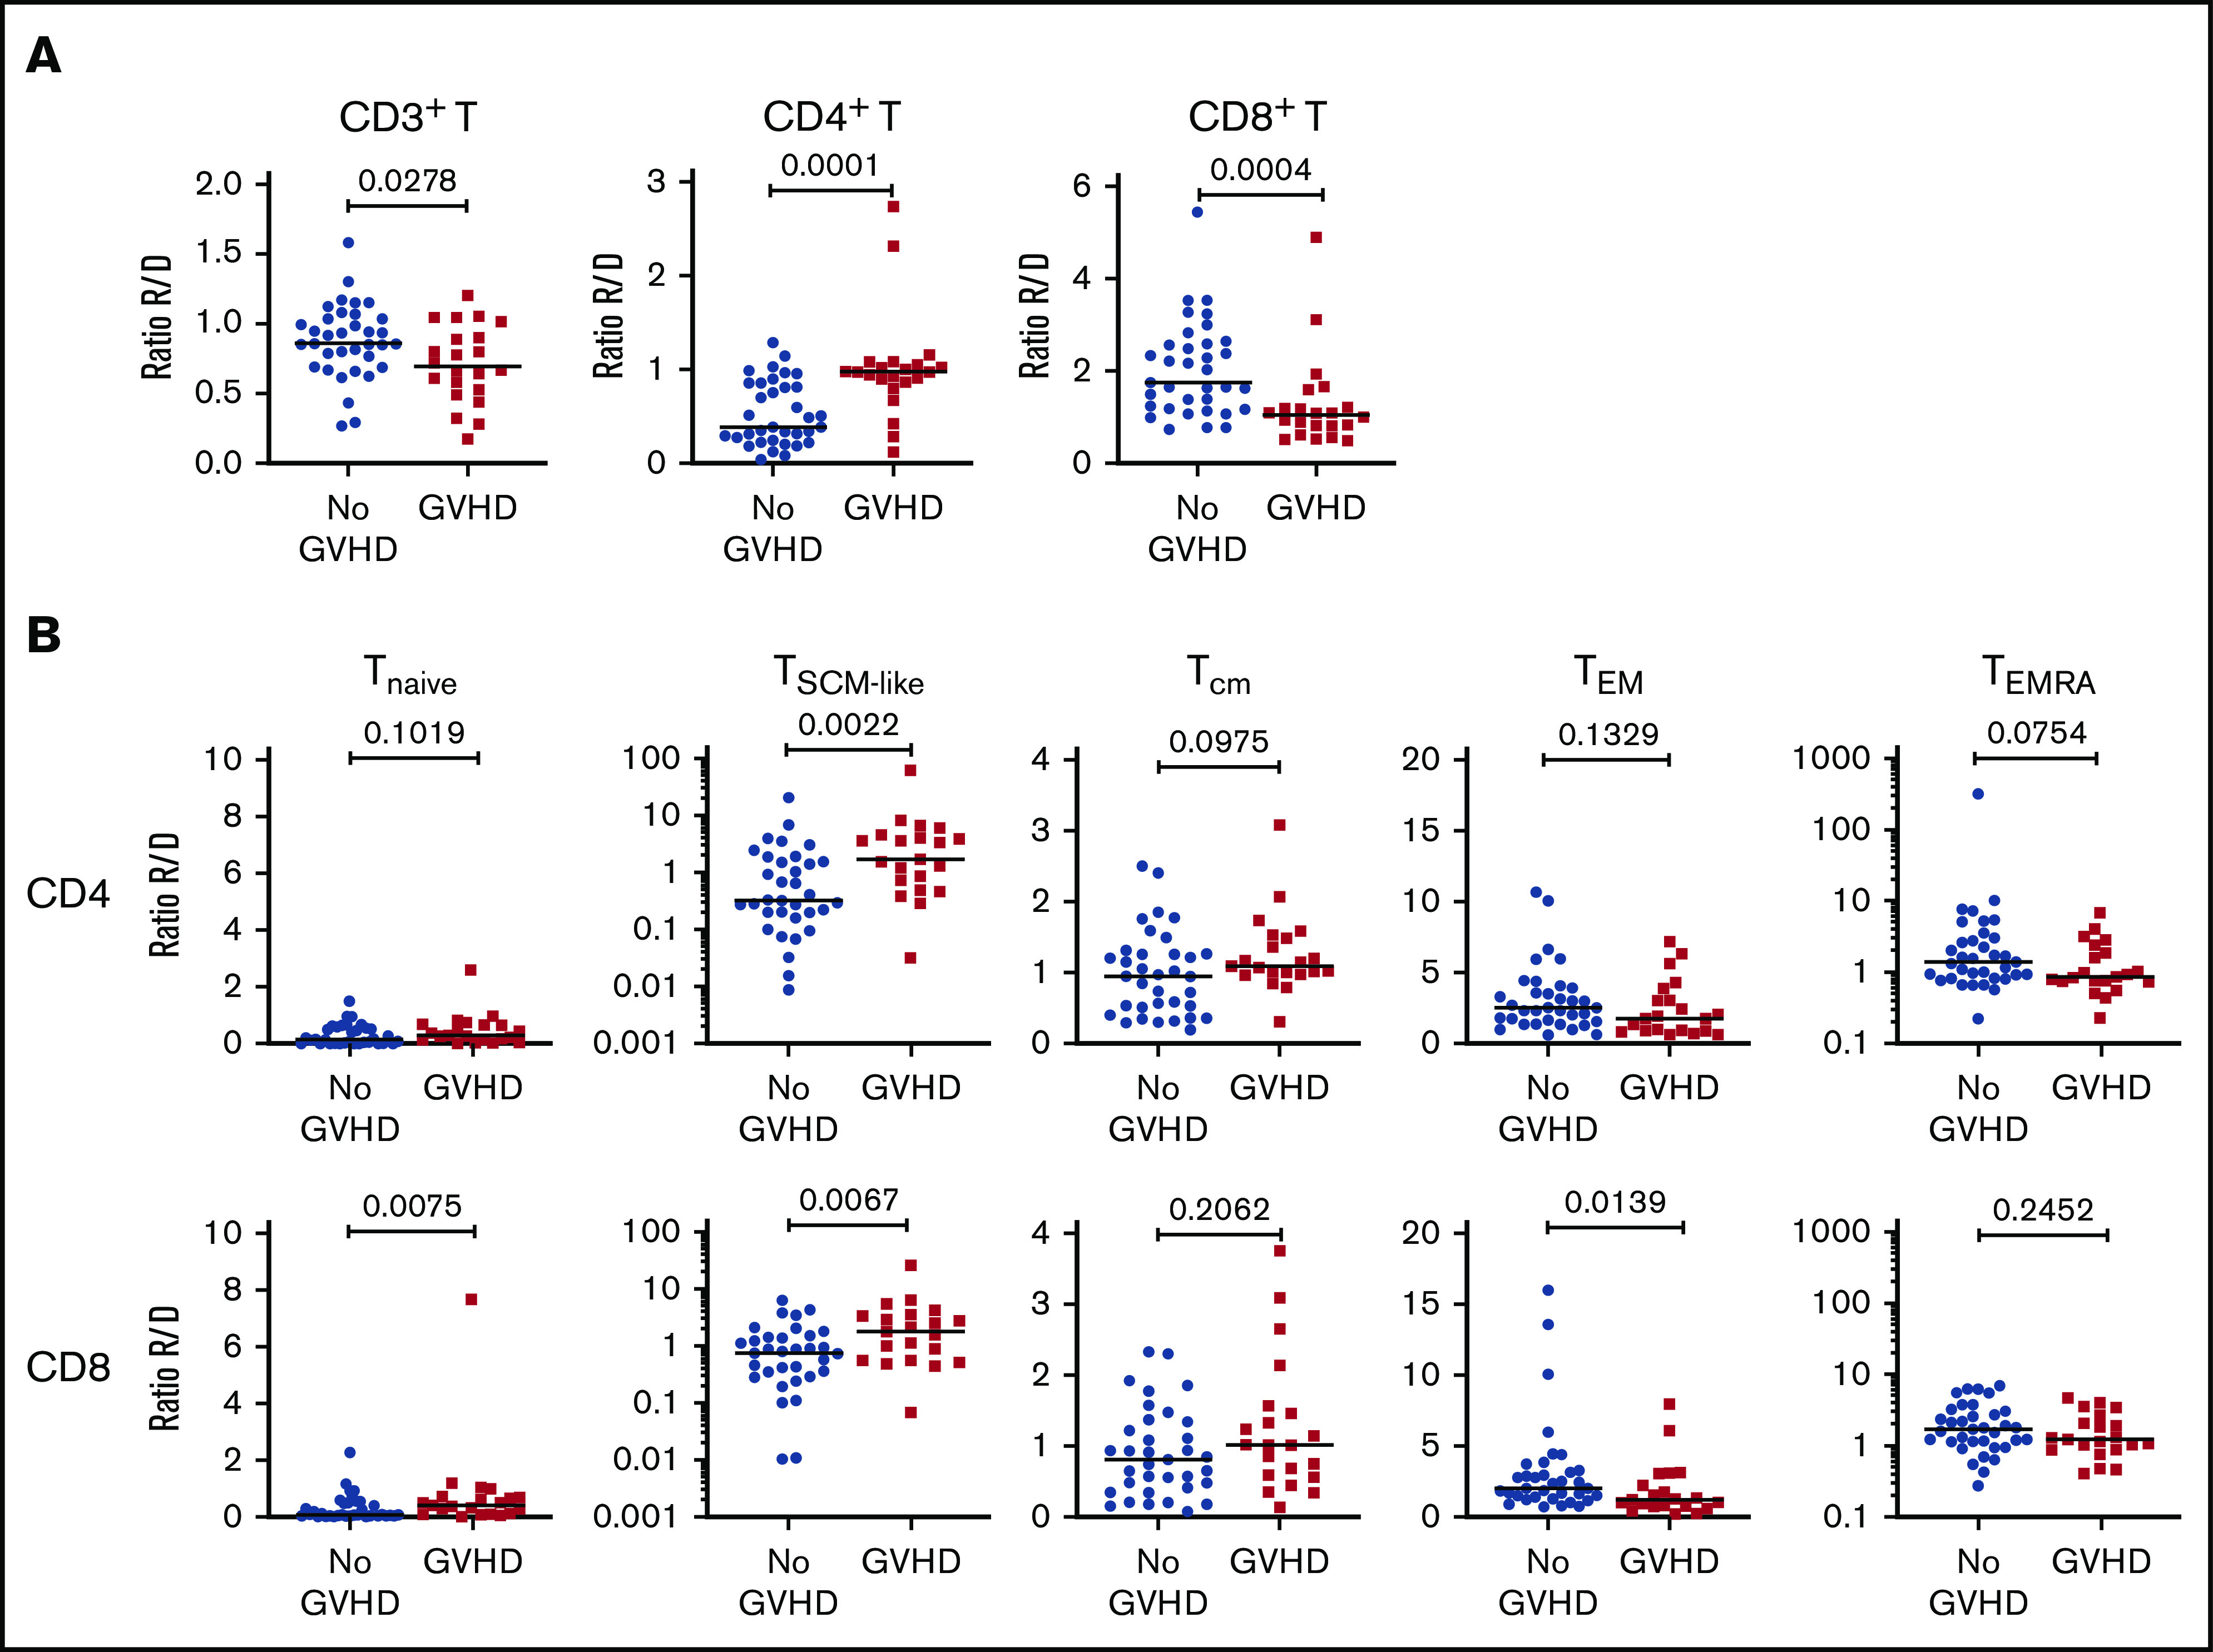
Figure 4.

Cellular correlates of aGVHD onset. (A) Ratios of the frequency of CD3+ T cells within lymphocytes (left panel), CD4+ T cells within CD3+ T cells (middle panel), and CD8+ T cells within CD3+ T cells (right panel) between recipients and donors (R/D) in aGVHD vs No aGVHD couples. (B) Ratios of the frequency of TNaive, TSCM-like, TCM, TEM, and TEMRA cells within CD4+ cells (upper panels) and CD8+ cells (lower panels) between R/D in aGVHD vs No aGVHD couples. Horizontal lines indicate the median. For this analysis, samples from the 2 cohorts were pooled. All recipients without aGVHD or with grade ≥2 aGVHD were included in the analysis (No GVHD, n = 36; GVHD, n = 22). P values were calculated using the Mann-Whitney U test; differences are considered significant for P < .05.
