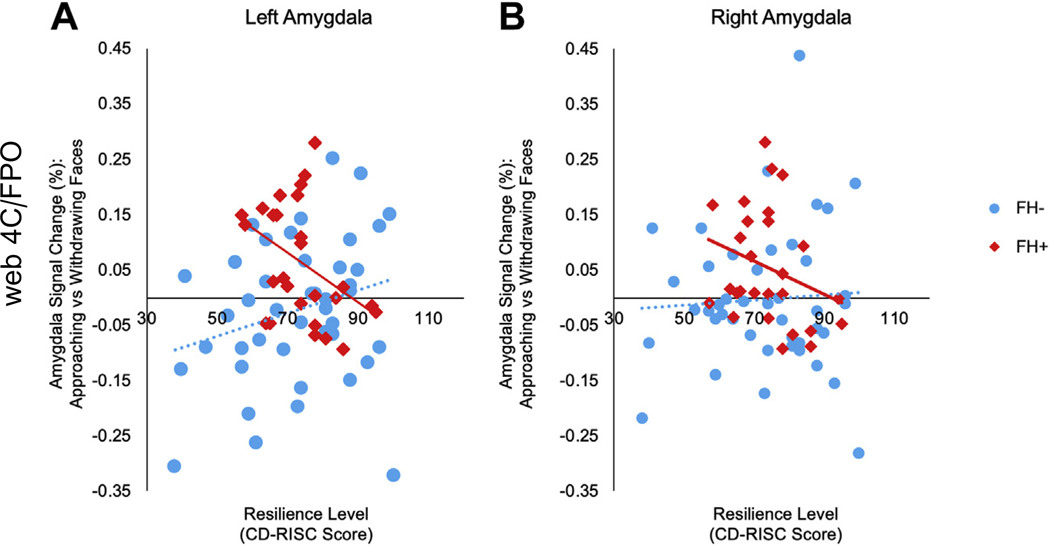
Figure 3.
Correlations between amygdala responses and resilience levels. For these correlational analyses, responses of the left and right amygdala for each subject were extracted using anatomically defined regions of interest generated by FreeSurfer from the T1 scan of each subject. The scatter plot in (A) illustrates the significant correlation between resilience level (as measured by the Connor-Davidson Resilience Scale [CD-RISC]) and the response of the left amygdala to looming faces in the group with a family history of depression (FH+) (r = −.41, p = .03, n = 27), whereas there was no significant correlation between responses of the left amygdala and resilience levels in the group without a family history of depression (FH−) (r = .26, p = .09). Moreover, the correlations between responses of the left amygdala and resilience levels in the FH+ and FH− groups were significantly different from each other (z = −2.48, p = .02). (B) Responses of the right amygdala to looming faces were not significantly correlated with resilience levels in the FH+ (r = −.28, p = .16) or FH− (r = .05, p = .71) groups.

