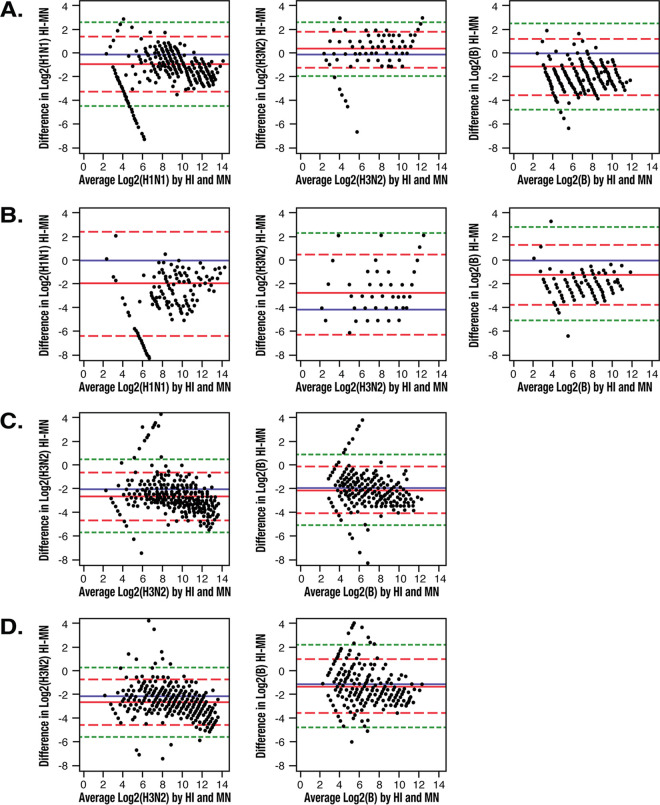
FIG 2.
Bland-Altman plots of difference in log2 (titer) hemagglutination inhibition (HI) assay minus the microneutralization (MN) assay against the average. The blue line represents a difference of 0 (no difference). The red solid line indicates the mean difference (equivalent to a systematic shift). The red dashed lines represent the mean differences ±2 standard deviations (SDs; the limits of acceptance) within which most of the pair measurements are expected to lie. The green dotted lines represent ±3 SDs from the mean difference. (A) Study 1 versus TIVc. (B) Study 1 versus TIVe. (C) Study 2 versus aQIV. (D) Study 2 versus QIV.

