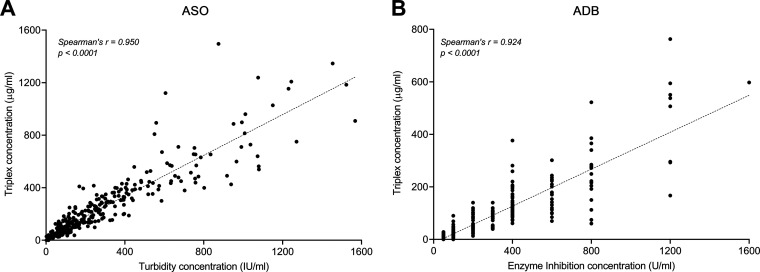
FIG 1.
Scatterplots showing the correlation between the triplex Luminex assay and clinically available methodologies for ASO (n = 317) (A) and ADB (n = 318) (B). Spearman’s r and P values are shown. The dashed lines represent the linear regression equations (see also Table S1 in the supplemental material).

