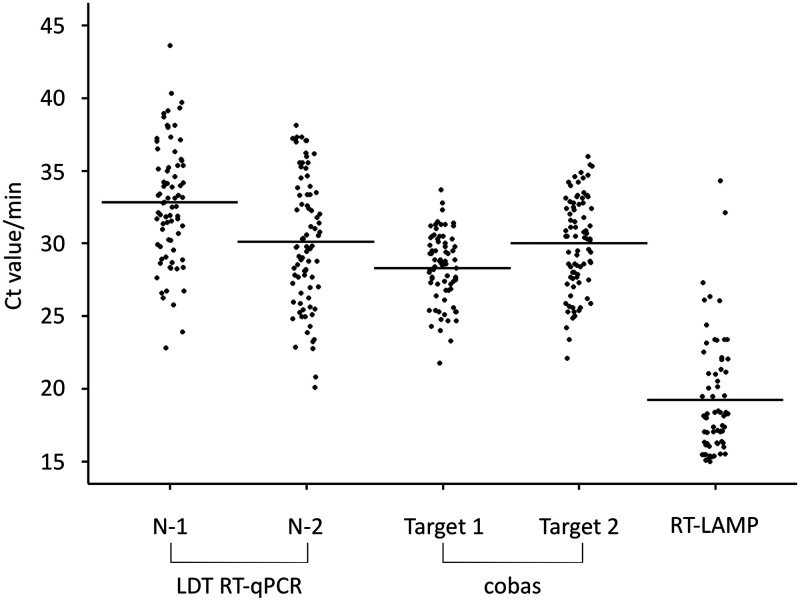
FIG 1.
Cycle threshold (CT) values and detection times for each molecular diagnostic test of saliva specimens. CT value for each RT-qPCR primer set and detection time by reverse transcription–loop-mediated isothermal amplification (RT-LAMP). Horizontal lines indicate the mean CT value or detection time.

