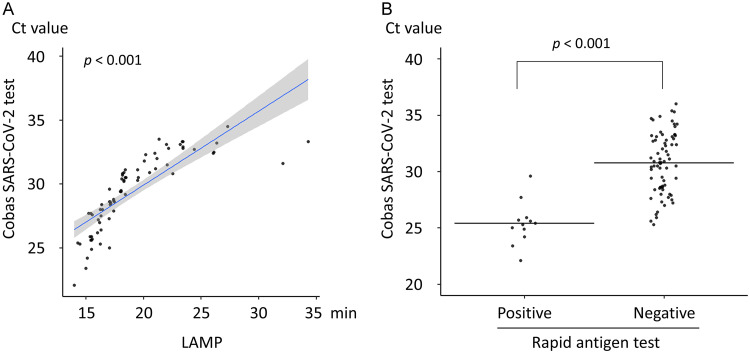
FIG 2.
Relation of RT-qPCR, RT-LAMP, and the rapid antigen test (RAT) results for saliva specimens. (A) Relation between the detection time of reverse transcription–loop-mediated isothermal amplification (RT-LAMP) and the CT value of target 2 (SARS-CoV-2 envelope gene) in the cobas SARS-CoV-2 test. The blue slope line represents the fitted regression curve. The gray shadow indicates the 95% confidence interval around the regression curve. (B) Distribution of the CT values of target 2 for the cobas SARS-CoV-2 test of saliva with positive and negative results. Horizontal lines indicate the mean CT value. The P value was calculated using Student’s t test.

