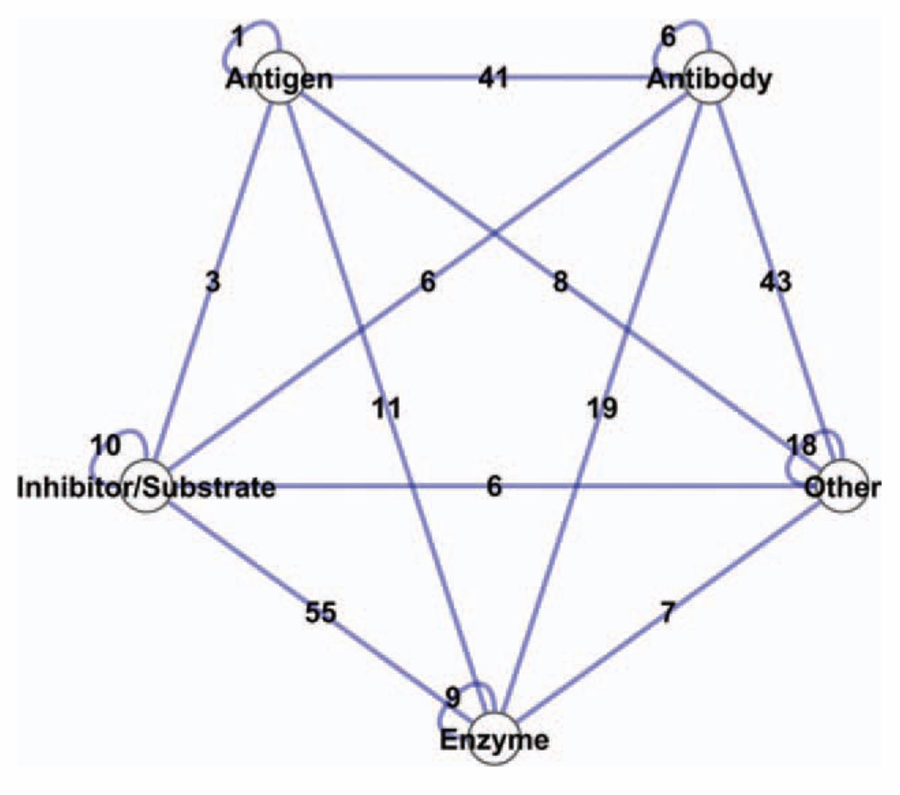
Figure 1.
Illustration of the extra interactions predicted by our method on the benchmark templates (88 interfaces). The 165 protein chains are categorized into five classes in line with Docking Benchmark classification. Each node represents one class, and each edge represents the number of predicted interactions between two classes. [Color figure can be viewed in the online issue, which is available at wileyonlinelibrary.com.]

