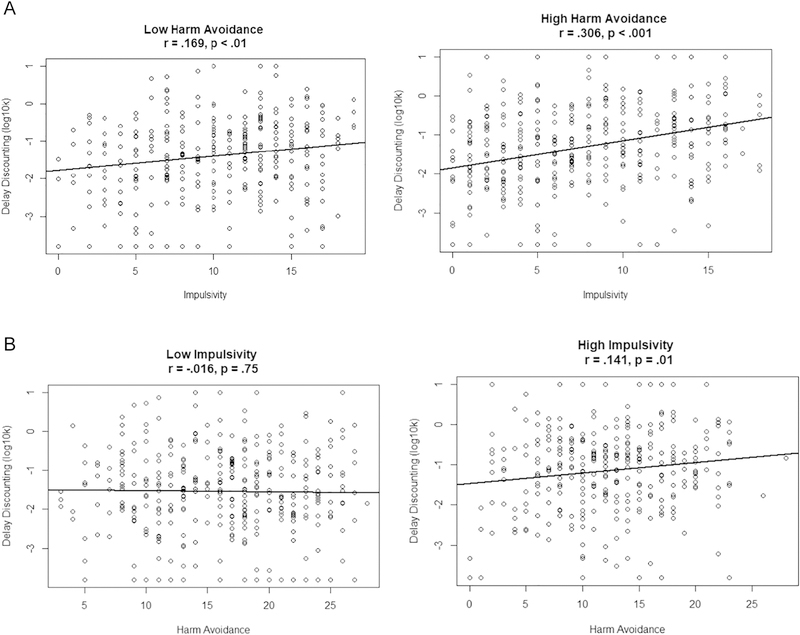
Figure 3.
Scatterplots depicting correlations between log10k (Delay Discounting Rate), Impulsivity, and Harm Avoidance divided into high and low groups. Figure 3a. Impulsivity by log10k delay discounting for those low and high in Harm Avoidance. Figure 3b. Harm Avoidance by log10k delay discounting for those low and high in Impulsivity.

