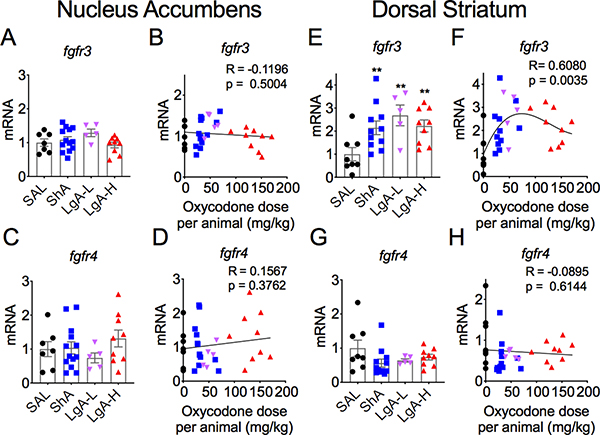
Figure 5. Increased fgfr3 mRNA expression in the dorsal striatum.
(A-B) fgfr3 and (C-D) fgfr4 mRNA levels are not affected by oxycodone withdrawal in the NAc. In contrast, (E-F) there were significant increases in striatal fgfr3 mRNA expression in all oxycodone rats whereas (G-H) striatal fgfr4 mRNA levels were not significantly impacted. The values in the bar graphs represent means ± SEM (n=5–15 animals per group). Note the differences in scales on the Y-axis for fgfr3 in comparison to the others. Key to statistics: ** = p < 0.01, in comparison to saline rats.

