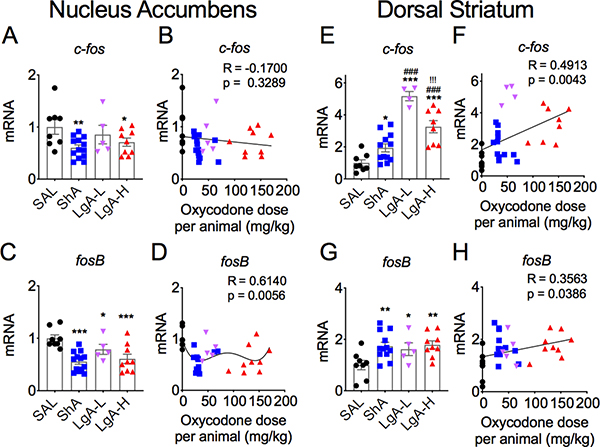
Figure 6. Differential changes in c-fos and fosB mRNA levels in the NAc and dorsal striatum after oxycodone withdrawal.
(A-B) c-fos mRNA levels are significantly decreased in the NAc of ShA and LgA-H rats. (C-D) fosB mRNA levels are decreased in the NAc of all oxycodone rats. (E-F) There were greater increases in striatal c-fos mRNA in the LgA-L and LgA-L rats in comparison to the ShA group. (G-H) Striatal fosB mRNA expression is increased to the same degree in all oxycodone rats. The values in the bar graphs represent means ± SEM (n=5–15 animals per group). Note the differences in scales on the Y-axis for each separate sub-figure, with striatal c-fos and fosB showing greater magnitude of changes after oxycodone withdrawal. Key to statistics: *, **, *** = p < 0.05, 0.01, 0.001, respectively, in comparison to saline rats; ##, ### = p < 0.01, 0.001, respectively, in comparison to ShA rats; !!! = p < 0.001, in comparison to LgA-L rats.

