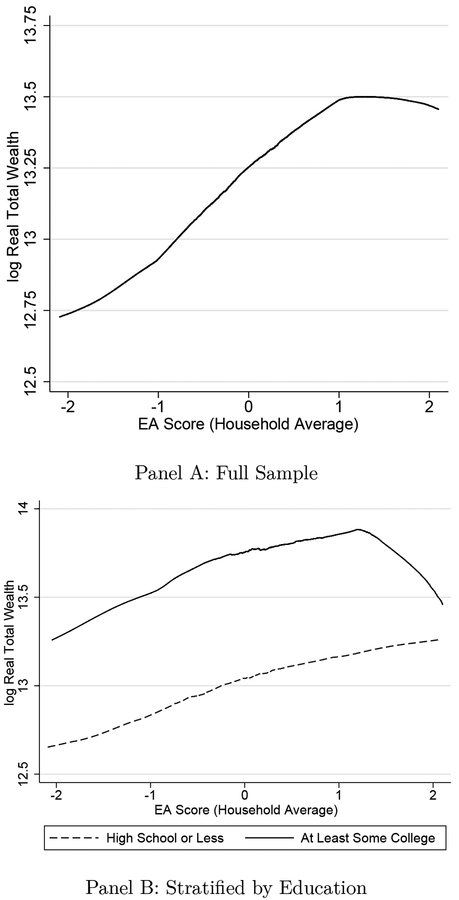
Figure 2:
Notes: Panel A plots average household EA score versus log household wealth using data for all household-year observations in the analytic sample. Panel B plots the same relationship for two subsamples of households, the first with a maximum education level of a high school degree or less and the second with at least one member having at least a college degree.

