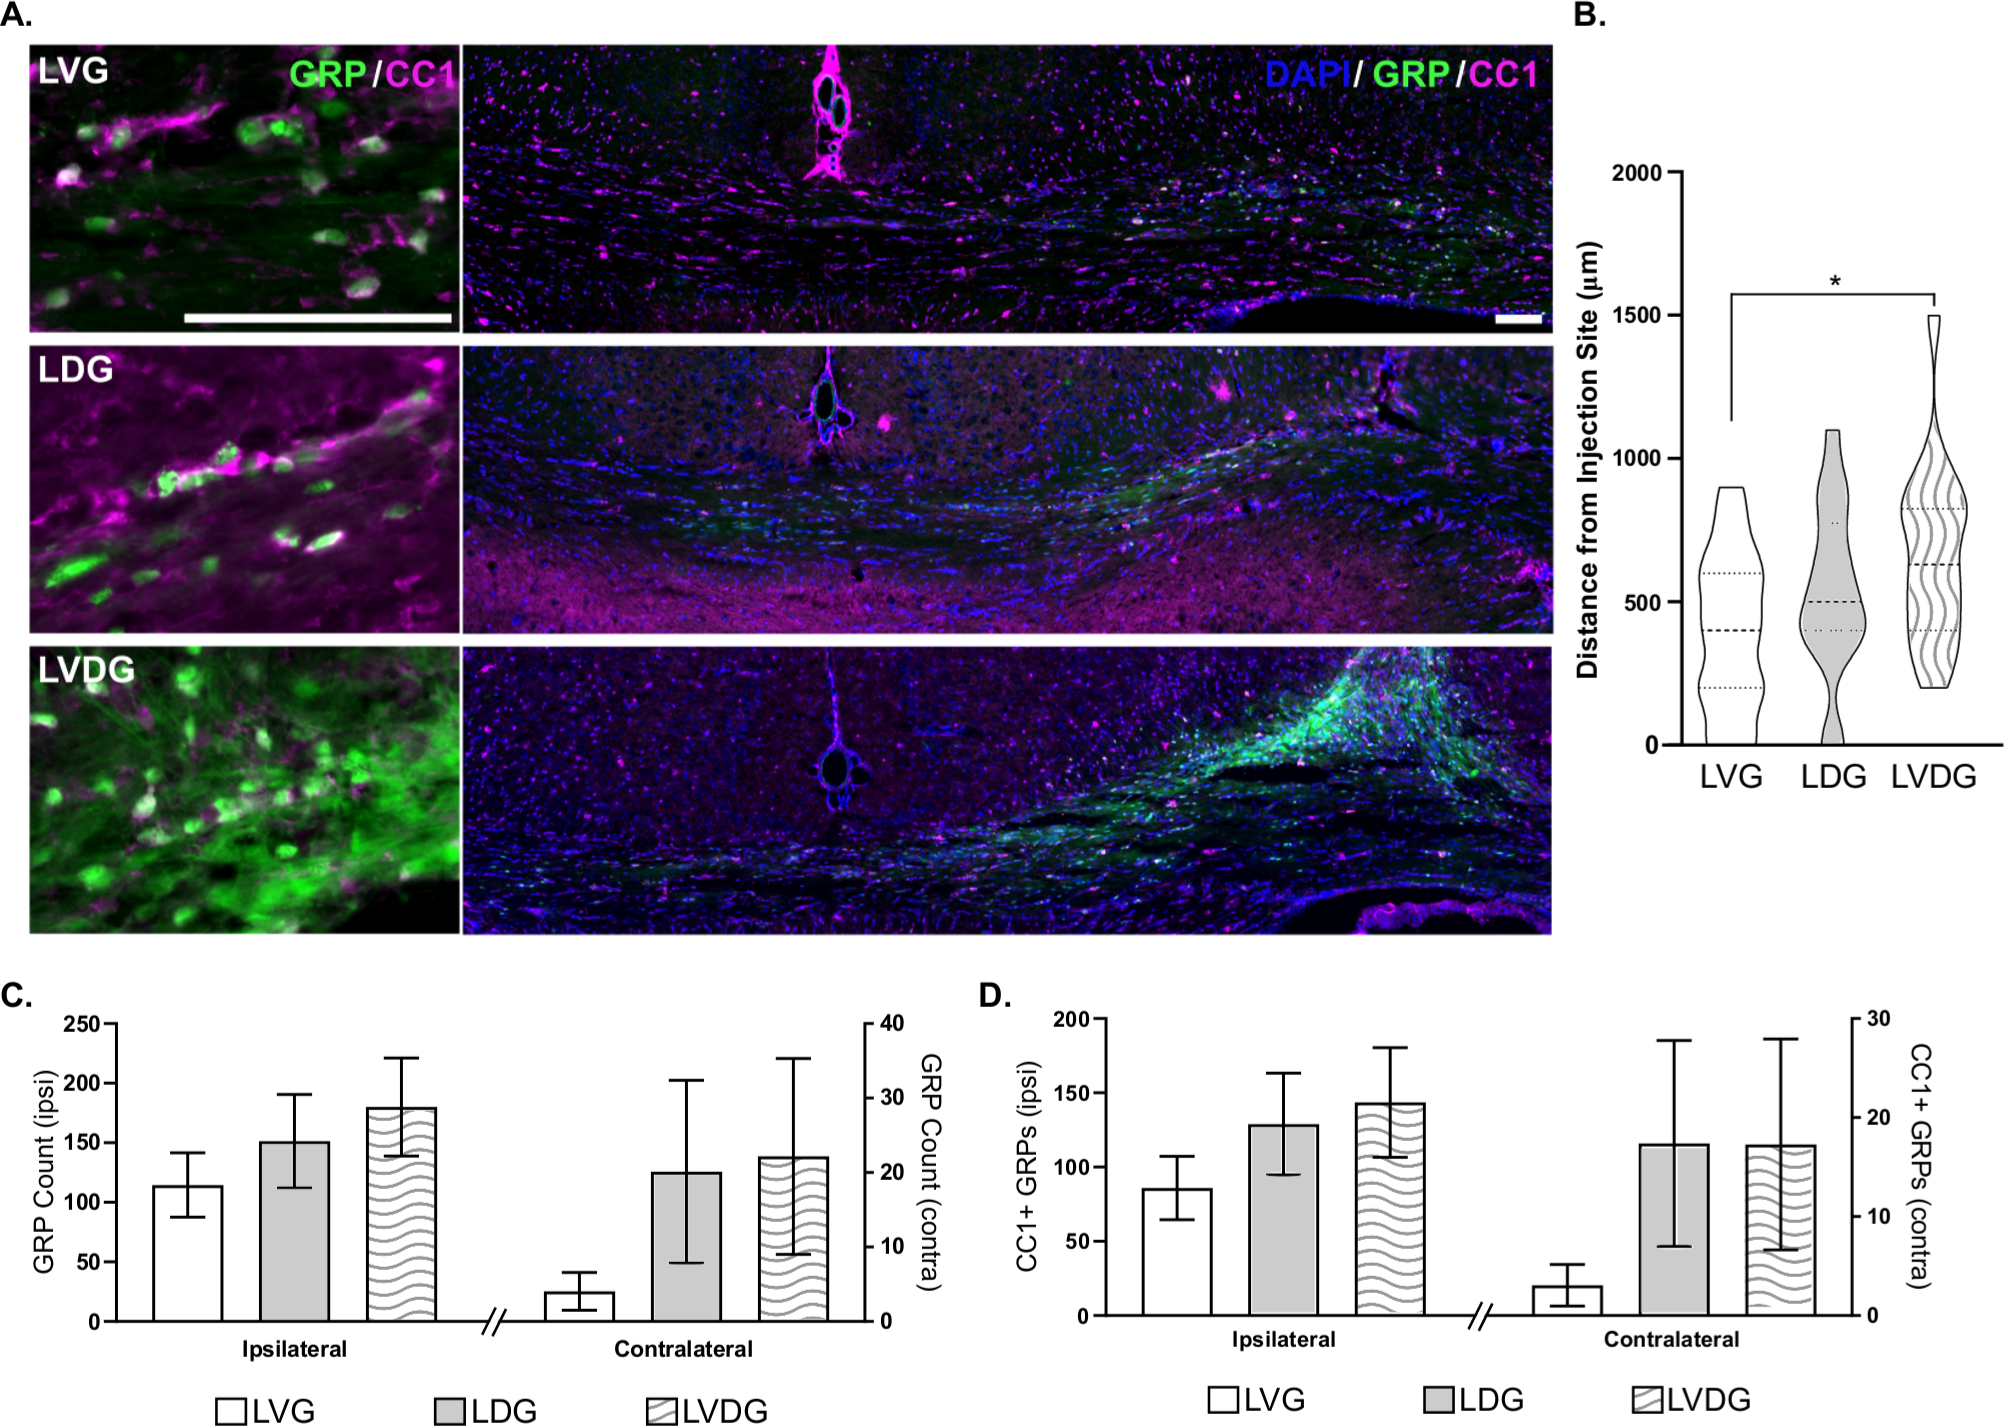
Figure 3:

A) Representative images for GRP (green) and CC1 (magenta) colocalization and GRP distribution from injection site. Scale bars equal 100 μm. Quantification of total number of GRPs in ipsilateral and contralateral hemispheres (B), maximum A/P distance of GRP travel from injection site (C), and CC1 differentiation and migration are indicated. Error bars indicate standard error of the mean. LVG: ligated, vehicle-treated P10, and GRPs at P22; LDG: ligated, D-NAC at P10, GRPs at P22; LVDG: ligated, vehicle-treated at P10, D-NAC preconditioned GRPs at P22.
