
Figure 3.
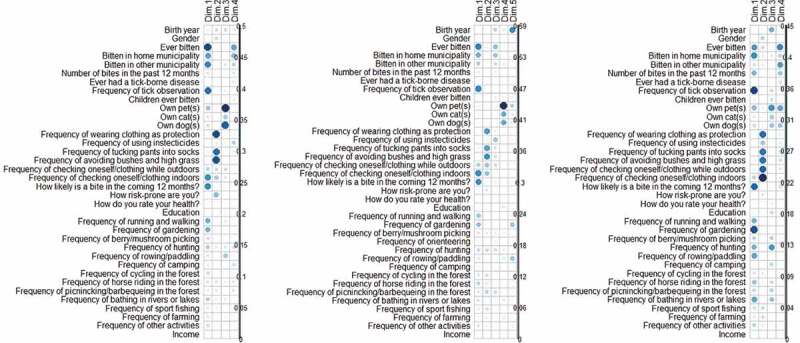
Legend: Correlation indices between original variables and the four (Denmark and Sweden) or five (Norway) dimensions bearing at least 5% of the total variance resulting from the principal component analyses (PCA) at country level on individual responses. Darker blue/larger circle indicate stronger contributions. The figure displays the PCA for Denmark, Norway and Sweden.