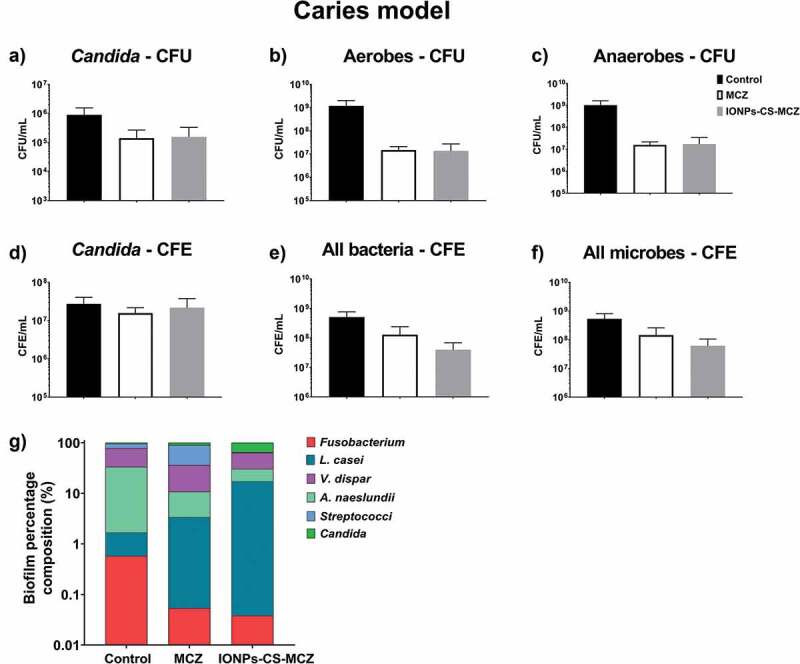
Figure 6.

Results of counting of colony forming units for total Candida (A), total aerobes (B) and total anaerobes (C) in MCZ- or nanocarrier-treated and untreated controls in the caries biofilm model. Colony forming equivalents of viable Candida and total bacteria cells are shown in panels D (Candida), E (bacteria) and F (all microbes). Biofilm percentage composition in treated and untreated controls represented in panel G, shown with Log scaling to depict all microbial genus/species. Percentage composition and raw CFE/ml for each microorganism is shown in Table 4 and Supplementary Table 1. Biofilms were treated anaerobically for 24 hours. Untreated biofilms were cultured under the same conditions minus drug treatment. Results shown representative of a total of 6 values (three technical replicates from two separate experiments).
