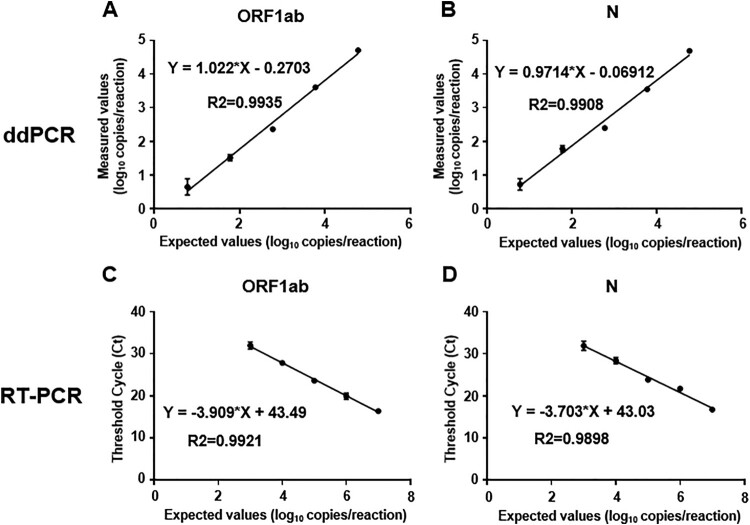
Figure 1.
Plot of results from a linearity experiment to determine the reportable range of ddPCR and RT-PCR targeting ORF1ab and N of SARS-CoV-2. (A and B) Expected values (converted to log10) were plotted on the X-axis versus measured values of ddPCR (converted to log10) on the Y-axis using Graph Pad Prism targeting (A) ORF1ab and (B) N. (C and D) Expected values (converted to log10) were plotted on the X-axis versus measured Ct values of RT-PCR on the Y-axis using Graph Pad Prism targeting (C) ORF1ab and (D) N. Data are representative of three independent experiments with 3 replicates for each concentration (means ± SD).

