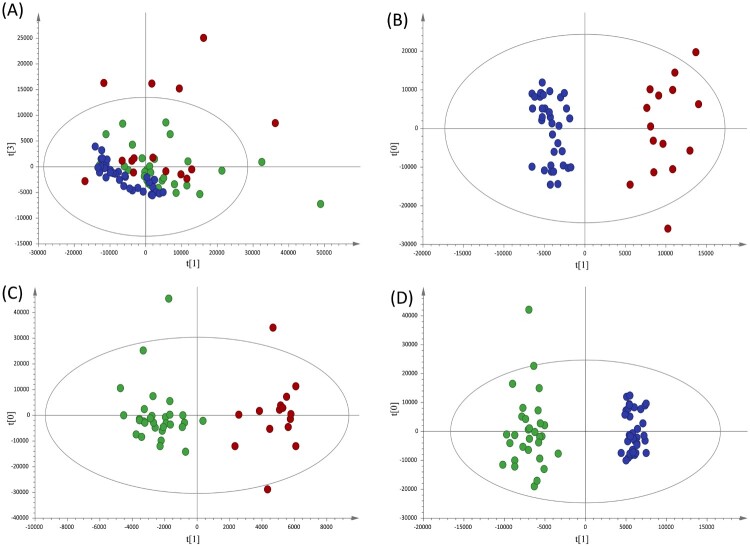
Figure 1.
Multivariate statistical analyses of the different clinical groups included in the study. (A) Principal component analysis (PCA) score plots of the healthy controls (HC, blue), house-hold contacts of active TB patients (HHC-TB, green) and active TB patients (A-TB, red) serum samples. Orthogonal partial least squares-discriminate analysis (OPLS-DA) score plots for the comparison between (B) A-TB (red) and HC (blue) (R2Y= 0.937, Q2Y= 0.893), (C) A-TB (red) and HHC-TB (green) (R2Y= 0.900, Q2Y= 0.428) and (D) HHC-TB (green) and HC (blue) (R2Y= 0.965, Q2Y= 0.915).

