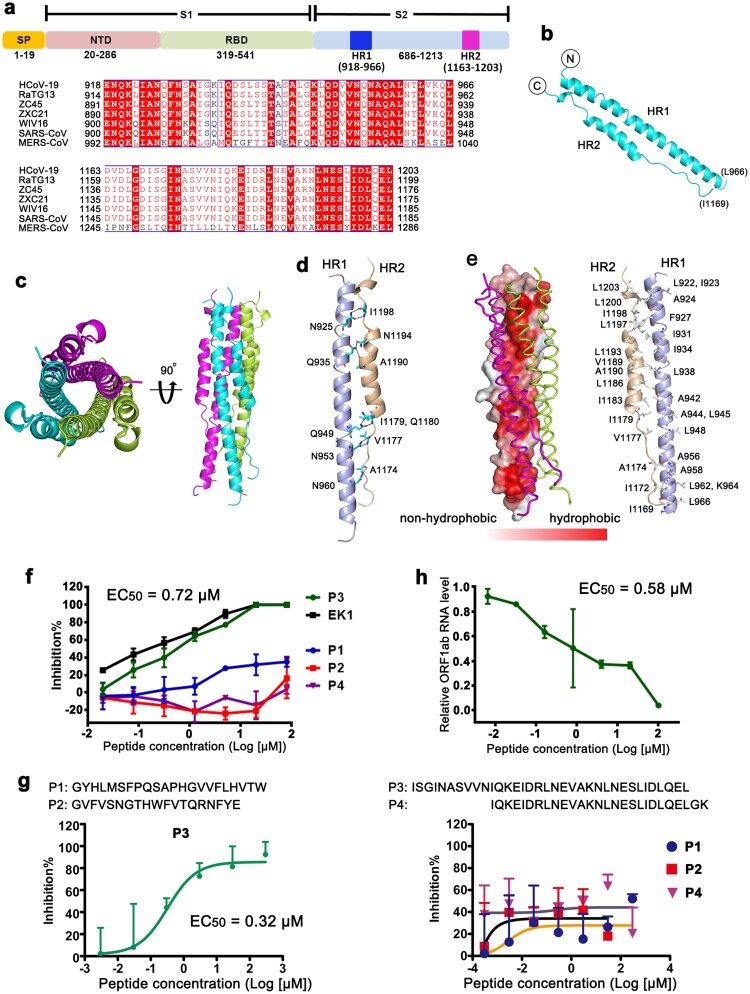
Figure 1.
Structure of fusion core of HCoV-19 and identification of an inhibitory peptide for virus fusion. (a) Schematic representation of the extracellular region of HCoV-19 spike protein (S). SP, signal peptide. NTD, N-terminal domain. RBD, receptor-binding domain. Sequence alignment between HCoV-19, RaTG13, ZC45, ZXC21, WIV16, SARS-CoV and MERS-CoV S proteins for the HR1 and HR2 regions is shown. (b) Overall structure of the HR1/HR2 complex. (c) Six-helix bundle fusion core structure yielded by symmetry operations. The three HR1/HR2 chains are colored lemon, cyan, and magenta, respectively. Structures in top view (left panel) and side view (right panel) are presented, respectively. (d) The detailed interactions between HR1 and HR2. Residues involved in the hydrogen bond interactions were shown as sticks and labeled. (e) Hydrophobicity map was presented on the left panel. The two contacted HR1/HR2 complexes were illustrated with ribbon representation. The right showed the hydrophobic residues constituting this hydrophobic surface. (f) Inhibitory activity of P1, P2, P3 and P4 peptides, which were derived from S protein, against HCoV-19 S mediated cell–cell fusion. EK1 peptide as the positive control. Experiments were performed twice, and the data are expressed as means ± SD (error bar) of one representative result. (g) Identification of inhibitory peptides derived from S protein with pseudotyped viruses. The percent inhibition (y-axis) was plotted against the log value of peptide concentration (x-axis), and the fusion inhibition curves are shown. Each point represented the mean + SD from triplicate experiments. The EC50 values were listed. These results were representative data from two independent experiments. (h) Evaluation of P3 against live HCoV-19 infection. The relative ORF1ab RNA level of HCoV-19 (y-axis) was plotted against the log value of peptide concentration (x-axis). The amount of HCoV-19 in the samples was determined by RT-PCR. Values were means + SD of three samples per group. Experiments were performed twice and one representative data was displayed.

