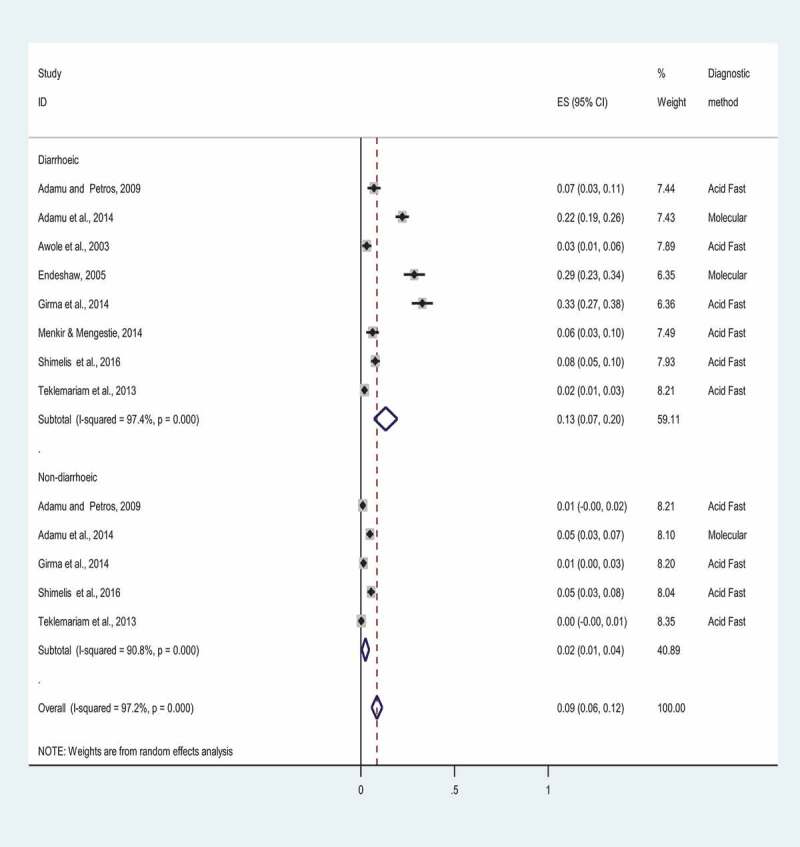
Figure 3.

Forest plot showing the prevalence of cryptosporidiosis among PLWHA in Ethiopia based on diarrhea status, 2001 to 2019. ES indicates a study’s effect size estimate with a point and 95% confidence interval with a horizontal line. The weight (in %) designates the impact an individual study has had on the overall prevalence estimate. The vertical line is the line of null prevalence. The diamond block shows the overall prevalence estimate in Diarrheic and Non-diarrheic patients. P-value (p < 0.001) suggests a statistically significant heterogeneity among studies.
