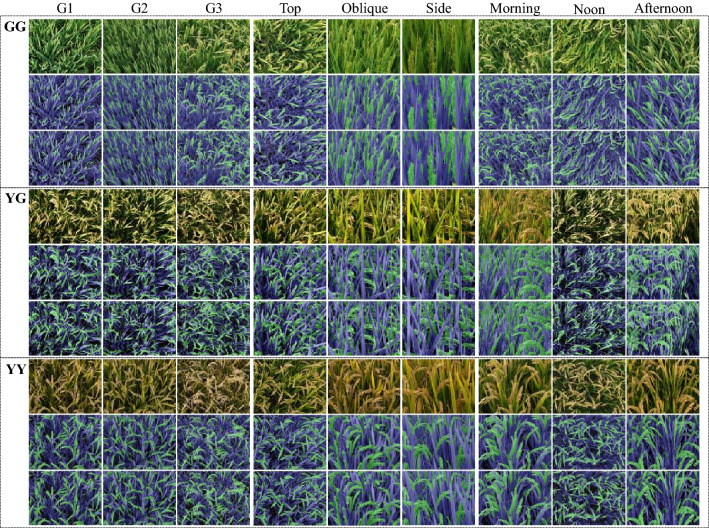
Fig. 5.
FPN-Mask segmentation results for 27 selected samples at three growth stages of GG, YG, and YY. At each stage, there are three blocks with 9 images from the left to the right, showing differences in genotype (G1, G2, and G3), camera angle (top, oblique, and side views), and solar angle (morning, noon, and afternoon), respectively. Within each block, rows from upper to bottom show the original image, the manually labeled ground truth, and the predicted results, respectively

