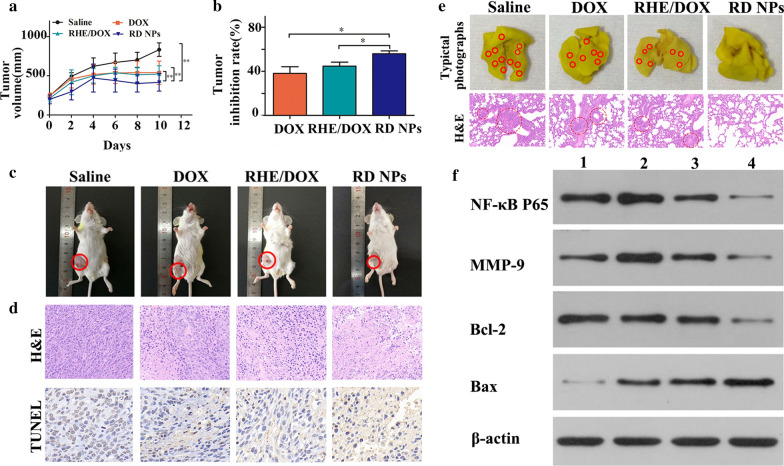
Fig. 6.
a 4T1 tumor growth curves of the study groups (n = 5, mean ± SD), including saline, DOX, RHE/DOX and RD NPs with an equivalent DOX concentration of 5 mg/kg. b Tumor inhibition in the study groups (n = 5, mean ± SD). c Representative images of the tumor-bearing mice captured 2 days after the final treatment. d Histological comparison of the tumor tissues at the conclusion of the study. e Representative photographs of whole lungs from mice in different groups and H&E staining of lung tissue sections. Surface lung metastatic lesions are denoted by red circles. f Western blots showing levels of the NF-κB P65, MMP-9, Bcl-2 and Bax proteins in tumors. Lane 1: blank; Lane 2: DOX; Lane 3: RHE/DOX; and Lane 4: RD NPs

