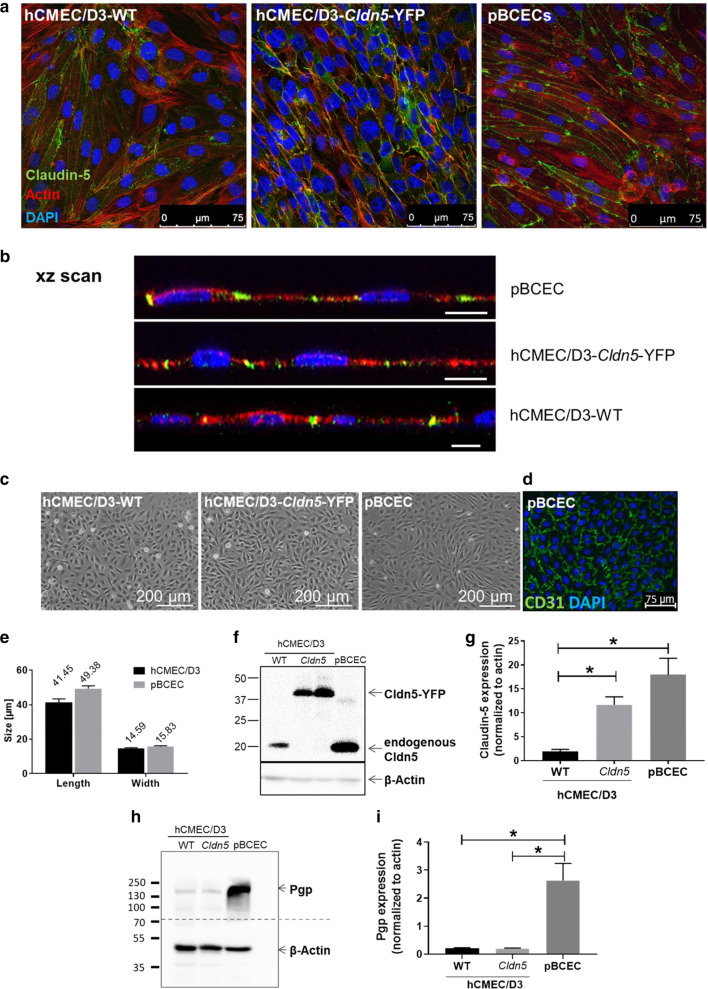
Fig. 2.
Comparison of cell morphology and localization and expression of claudin-5 and Pgp in hCMEC/D3-WT, hCMEC/D3-Cldn5-YFP and pBCECs. a Claudin-5 was indirectly stained (hCMEC/D3-WT and pBCECs) or visualized by YFP tag in the stably transduced hCMEC/D3-Cldn5-YFP cell line (for better visualization both claudin-5 and Cldn5-YFP are depicted in green). F-Actin is shown in red and cell nuclei are counterstained in blue by DAPI. b An xz scan of the cell layer revealed interendothelial (junctional) localization of claudin-5 (green) in the two cell lines and pBCECs. Scale bars: 10 µm. c Phase contrast micrographs of hCMEC/D3-WT, hCMEC/D3-Cldn5-YFP and primary pBCEC cultures. d Purity of pBCEC isolation, evaluated by fluorescent staining for the endothelial cell marker CD31 (green). Cell nuclei were counterstained with DAPI (blue). e Length and width of hCMEC/D3 and pBCECs. f Representative Western blot showing claudin-5 (Cldn5) expression in hCMEC/D3-WT (7 days after seeding), hCMEC/D3-Cldn5-YFP (7 and 21 days after seeding) and pBCEC cultures (7 days after seeding). β-actin was used as a loading control. g Quantification of Western blot bands and normalization of claudin-5 expression to β-actin. Data are represented as mean ± SEM of n = 3 independent experiments. Significant intergroup differences are indicated by asterisk (*P < 0.05). h Representative Western blot showing Pgp expression in hCMEC/D3-WT, hCMEC/D3-Cldn5-YFP and pBCEC cultures. β-actin was used as a loading control. i Quantification of Western blot bands and normalization of Pgp expression to β-actin. Data are represented as mean ± SEM of n = 3 independent experiments. Significant intergroup differences are indicated by asterisk (*P < 0.05)

