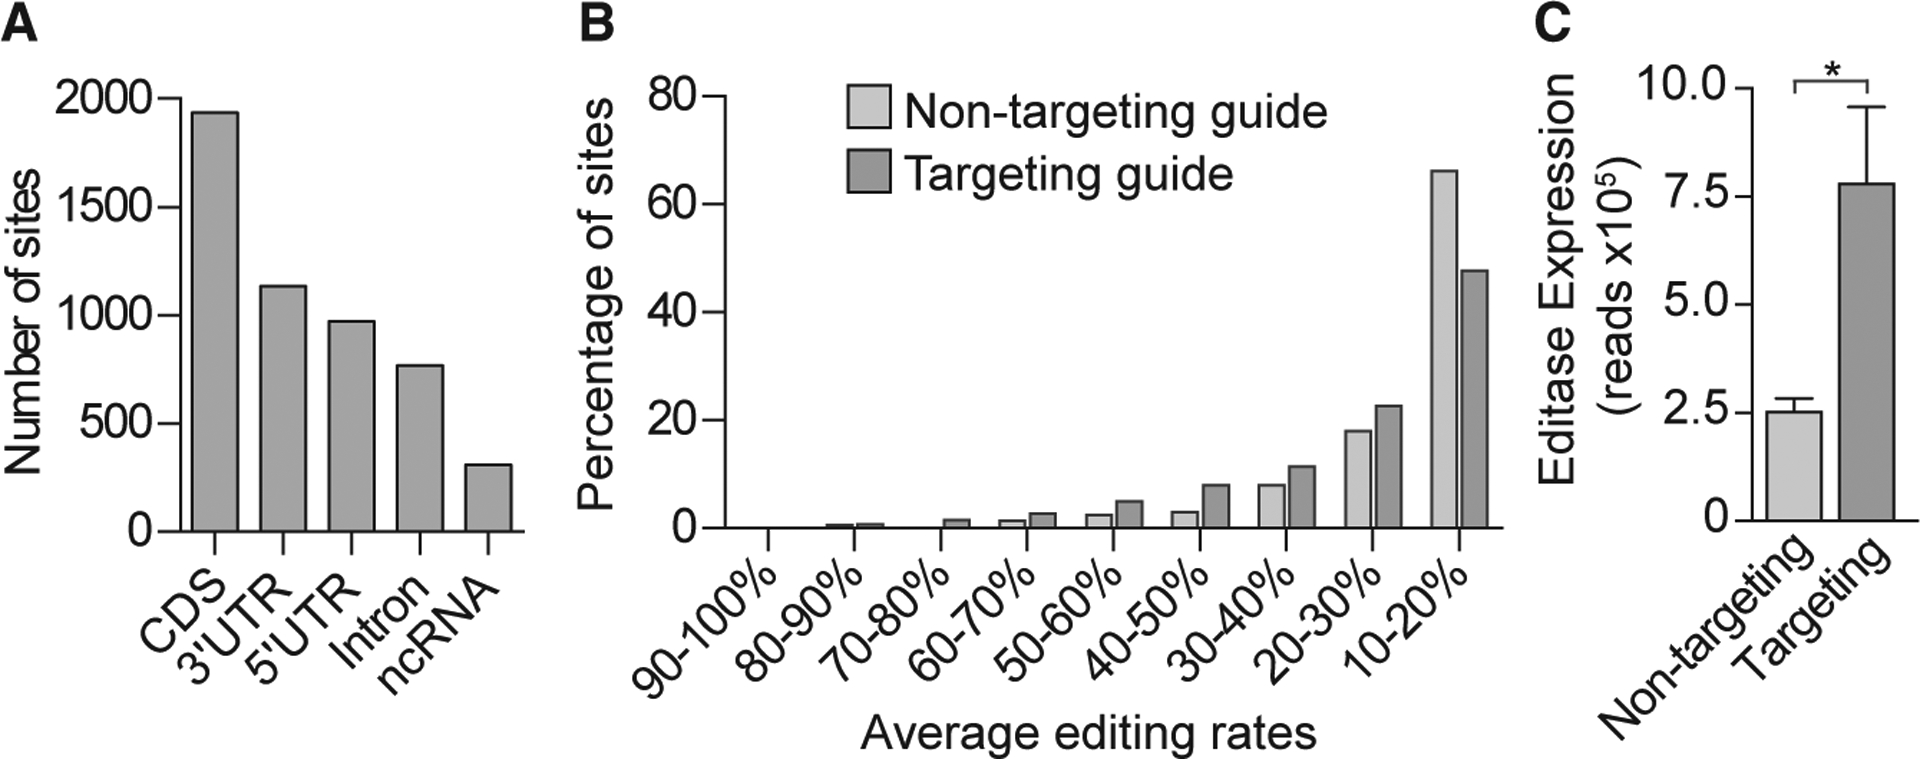
Figure 3. Off-Target Editing Rates Determined by Whole-Transcriptome Analysis in the DG Are Graded and Depend on the Level of Editase Expression.

(A) Histogram showing the number of total off-target sites, independent of injection condition, located in coding sequences (CDSs), 3’ untranslated regions (UTRs), 5’ UTRs, and non-coding RNA (ncRNA).
(B) Histogram showing the percentage of transcriptome-wide RNA editing sites, binned according to the average editing rates (n = 3 biological replicates.
(C) Editase RNA-seq reads (mean ± SD, n = 3 mice/condition) that aligned to the editase CDS for each injection condition. *p < 0.05, two-tailed unpaired t test.
